Project Overview.
DoryVR is a mixed-reality platform that enables students to deliver interactive presentations in both VR (Virtual Reality) and AR (Augmented Reality). With DoryVR, users can utilize features such as personalized presentation dashboards, customizable levels of immersion, and scalable, interactive 3D data visualization. Designed for the Meta Quest platform, DoryVR can be configured and deployed on any Meta headset using SideQuest or Unity Software Build.
Role
User Experience Designer
Explore
Data Storytelling
in Extended Reality
with DoryVR
Duration
Jan - May 2024
Team
2 UX Designers, 2 Programmers,
1 Product Manager
Responsibilities
Interface Development,
User Research/Validation,
Unity Managing and Prototype,
VR Testing
Client
Carnegie Mellon University
Heinz College of Management
Environment
Unity — Meta Quest
Context.
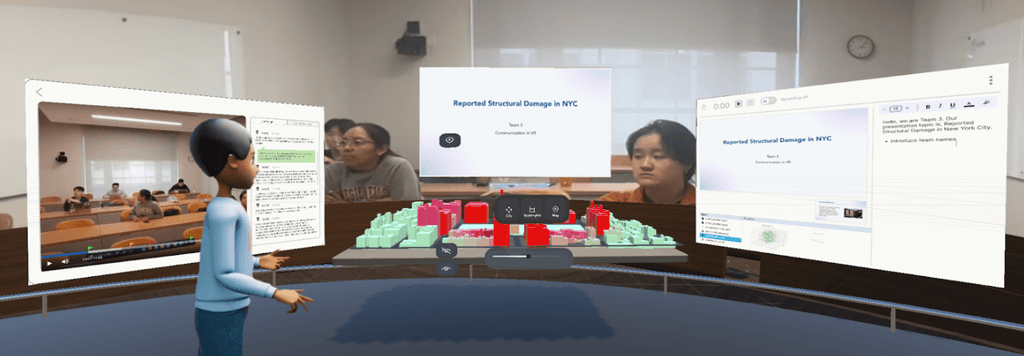
Our client, Dr. Kim Hyatt, is a professor at Heinz College who teaches the course “Communication in VR.” This course teaches master’s students the skills to present data effectively in virtual reality (VR). Dr. Hyatt currently uses the VR program Spatial for her class, but she was unsatisfied with this software and was seeking for refinement.
Solution.
To address this, our team has developed DoryVR, a custom XR (Extended Reality) platform designed to enhance students' ability to present 3D data visualizations, engage audiences, and improve storytelling and self-reflection skills. Through one round of primary research and three rounds of user testing with course participants, we created an interactive and enjoyable tool that leverages the unique capabilities of VR and AR (Augmented Reality).
Before Everything.
Problem Space: Why our client needs us?
XR (Extended Reality, including Augmented and Virtual Reality) is becoming more common in the hybrid workplace. A 2022 PwC study found that 51% of companies are incorporating VR into their operations. The course "Communication in VR" aims to give students experience with this emerging medium, focusing on data communication. Currently, students use the VR program Spatial, which lacks support for custom 3D media, leading to reliance on 2D slides and screenshots. This limitation often results in visual clutter, information overload, and decreased engagement.
The overarching goal of our team is to design and create a custom environment in VR that enhances the data storytelling experience for students enrolled in the Heinz College course “Communication in VR.”

We conducted…
13 Literature Reviews.
5 User Interviews.
4 Comparative Analysis.
5 Expert Interviews.
2 In-class Observation Sessions
How do we make the process behind learning how to storytell with data in VR more involved for students?
We conducted literature reviews on data storytelling, VR education, and VR data visualization. We also performed a comparative analysis of four prominent VR data visualization tools.
What are students’ behaviors and learning processes behind VR communication and data storytelling?
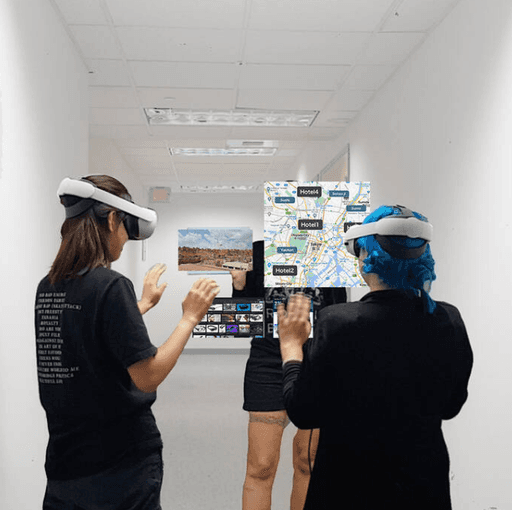
We conducted two classroom observations, where we shadowed both students and instructors to observe teaching and learning dynamics. We followed this with five contextual inquiries to understand students' behavioral patterns, challenges, and goals in VR presentations and communication. Additionally, we interviewed five experts in data visualization, storytelling, and VR as an educational technology. These interviews provided us with contextual knowledge and insights into future trends.
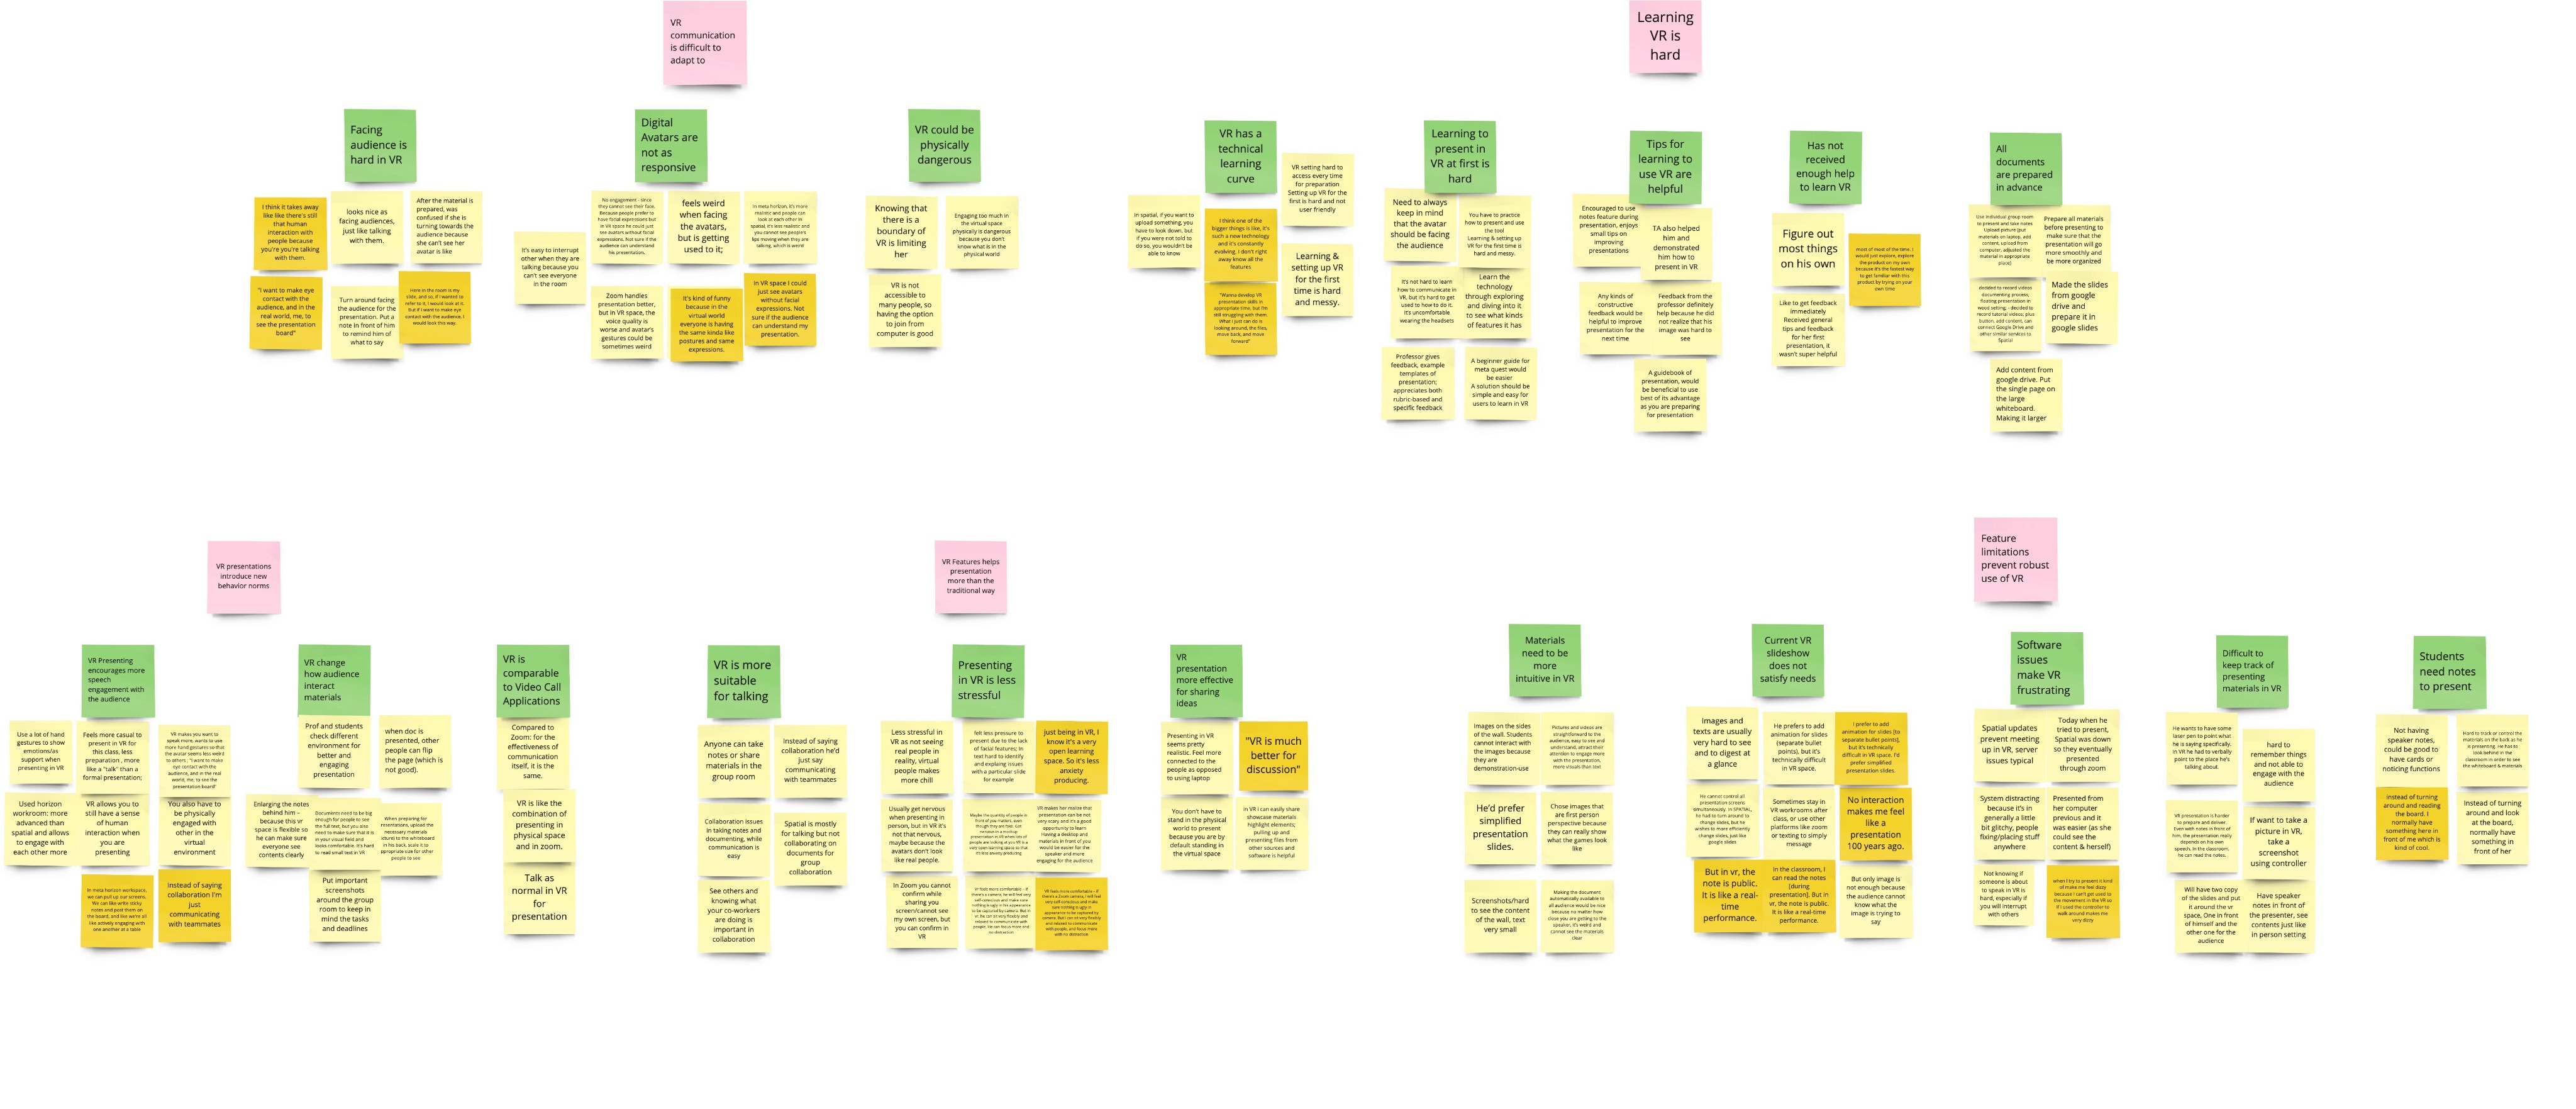
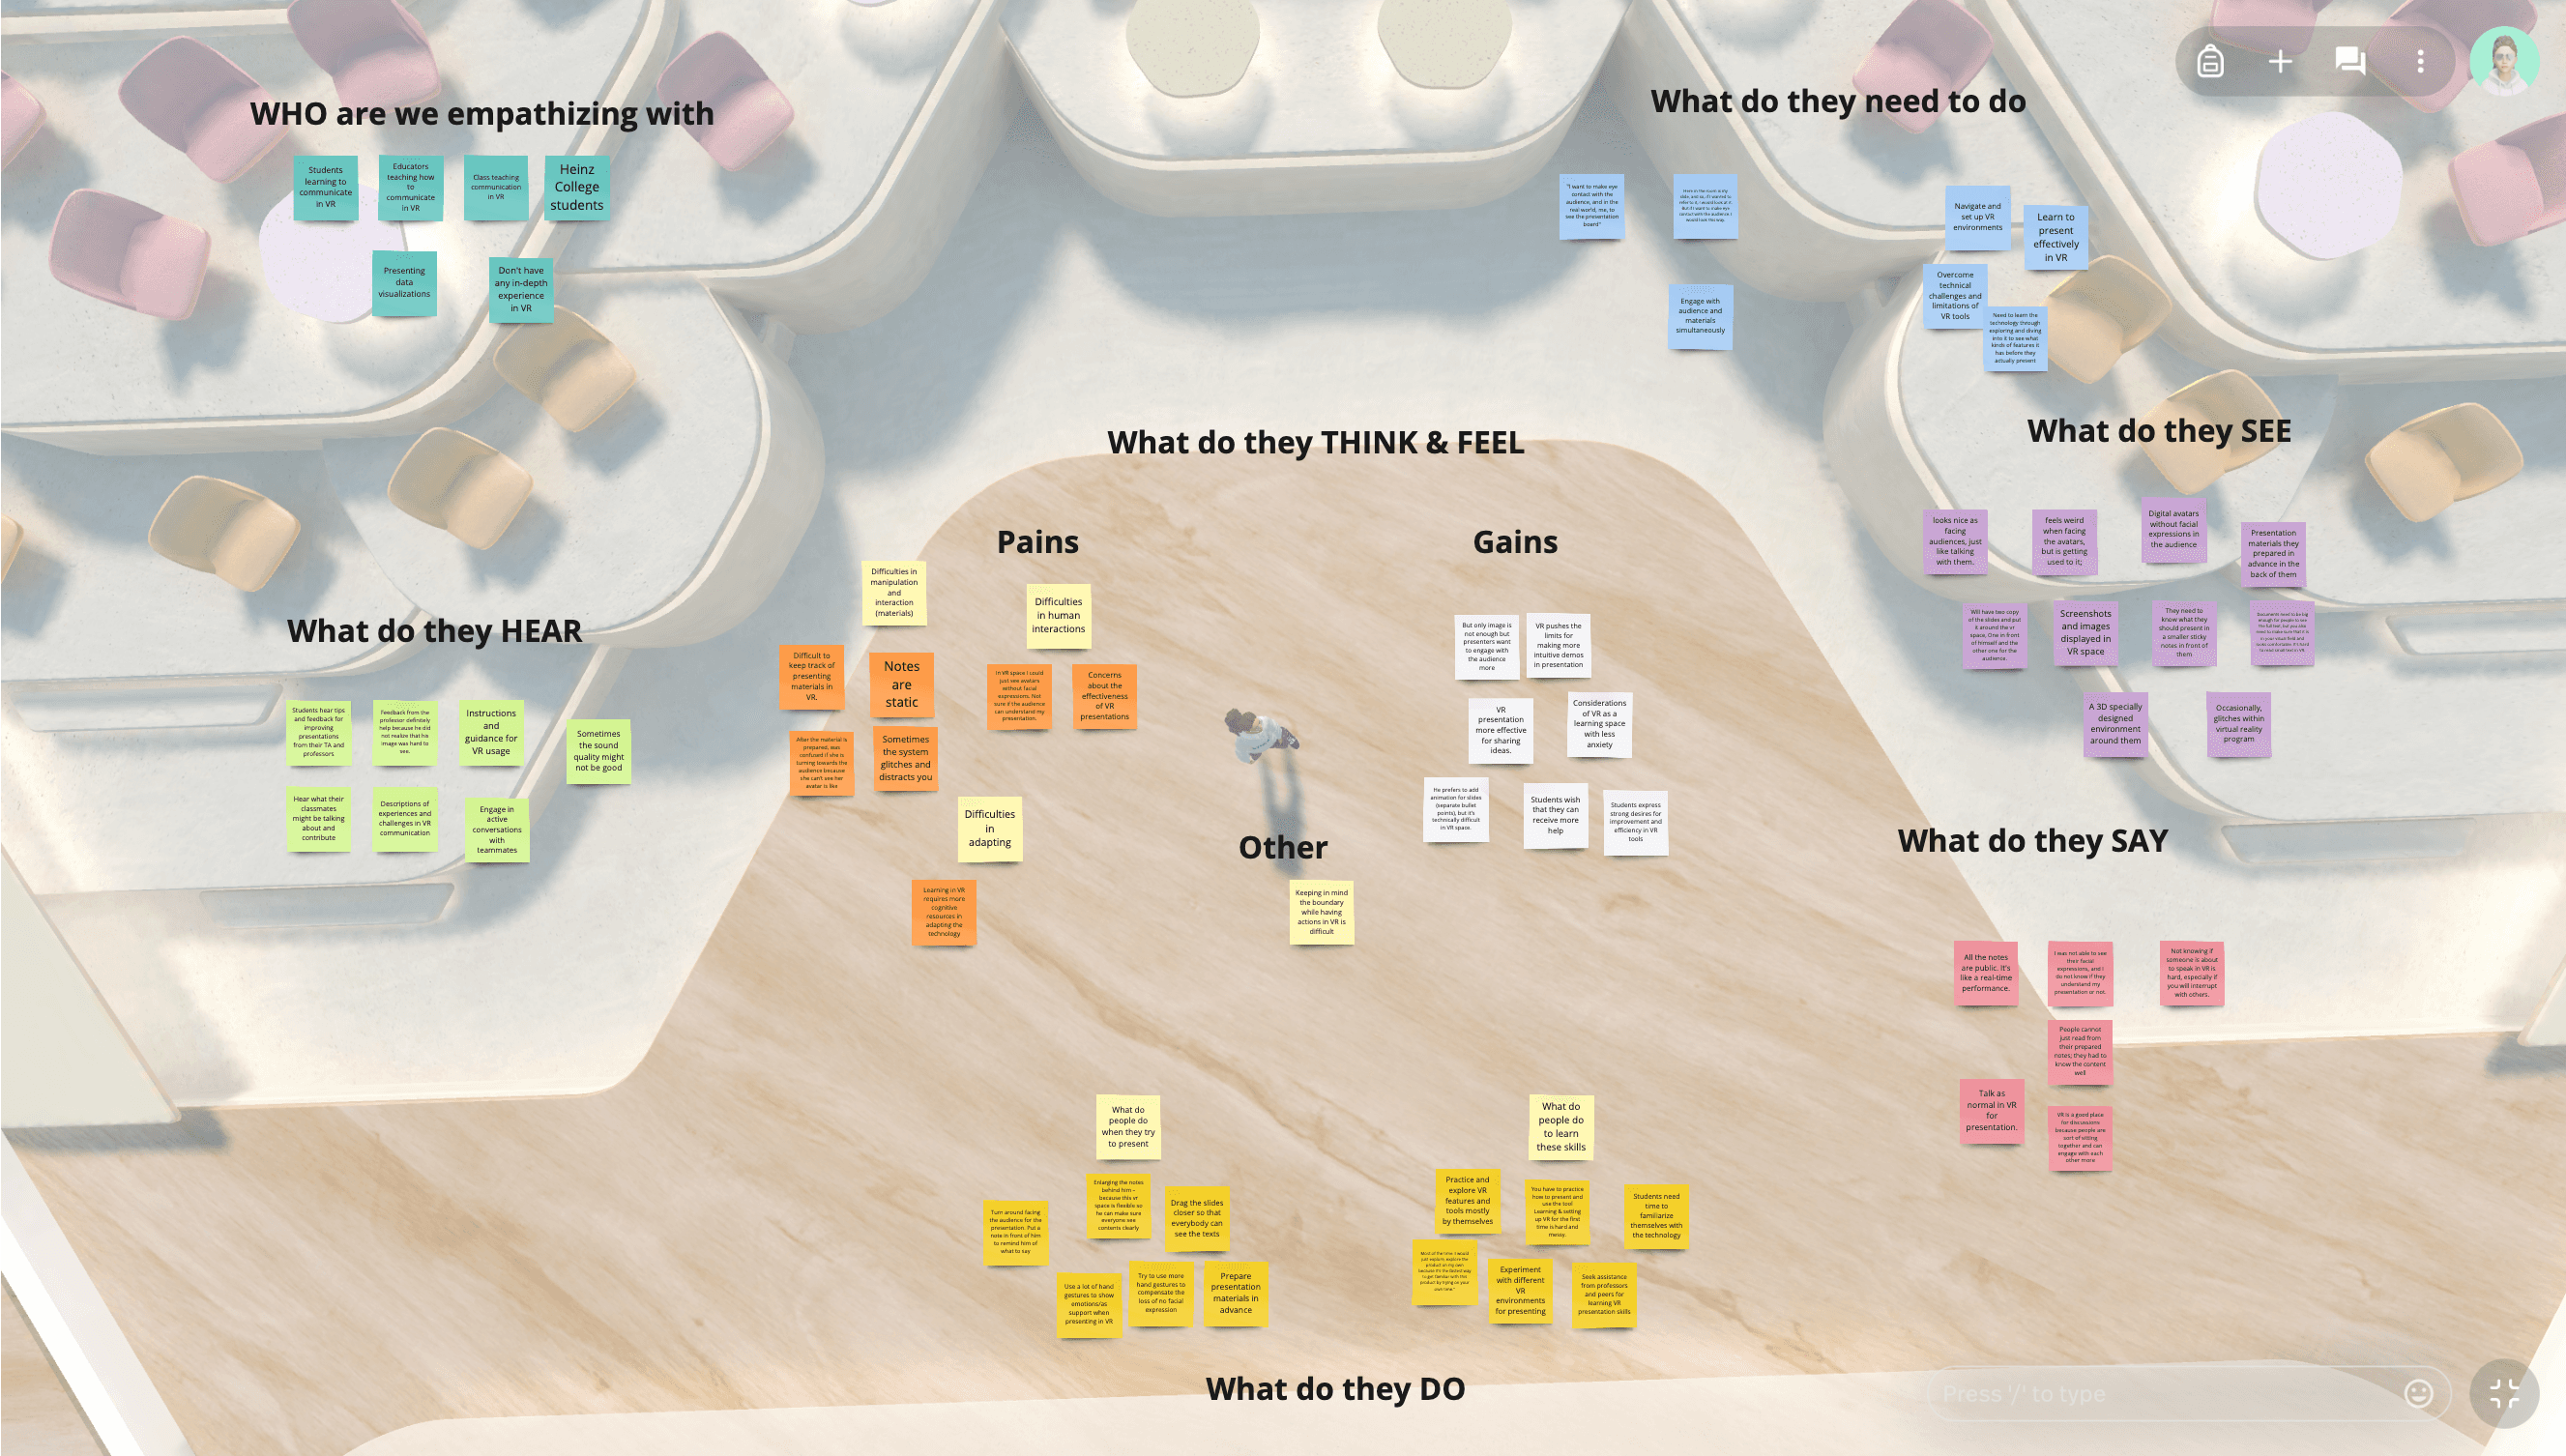
After data collection, we used an affinity diagram to identify common themes and created an empathy map to visualize user experiences. Our preliminary research findings can be categorized into three areas: general presentation in VR, presenting data in 3D, and the advantages of AR versus VR."
Findings and Insights
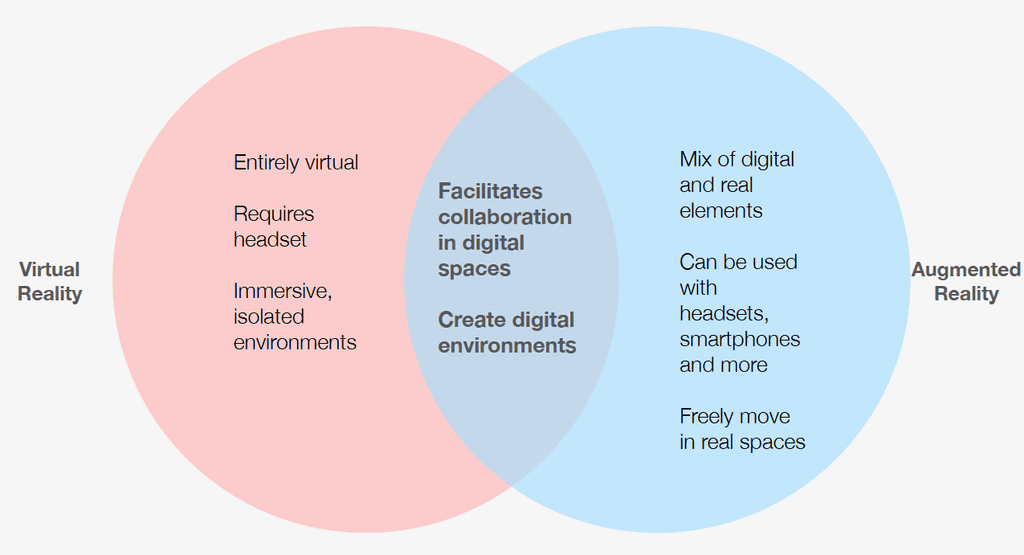
XR (Extended Reality) expands the scale of accessible interactions and behaviors, offering increased flexibility.
However, despite the class being conducted entirely in VR, 80% of our participants reported experiencing varying degrees of dizziness or motion sickness during our interviews, highlighting accessibility issues within VR. To address this, we explored Augmented Reality (AR) as an alternative, where such symptoms are less common. AR allows students to move freely within their physical environment while still interacting with virtual class elements. Our competitive analysis indicates that AR is also gaining traction as a tool for business meetings. An expert in VR conference applications noted, 'AR is going to be a much more important factor in meeting apps moving forward.'
XR (Extended Reality) transforms the scale of accessible interactions and behaviors, offering greater flexibility than traditional mediums.
A multi-sensory experience in XR cannot be replicated on a conventional flatscreen display. An Educational XR Technology researcher noted that 'XR enables us to walk through the [virtual] galaxy or explore the intricacies of the human heart.' Students observed that changes in spatial perception within XR encouraged them to communicate ideas differently. Participants shared insights such as, 'VR space is flexible; we can switch between scenes and rearrange notes' (P4), and 'VR makes you want to speak more and use more hand gestures during presentations' (P2).
"XR (Extended Reality) significantly alters the scale of accessible interactions and behaviors, providing greater flexibility than traditional methods.
Our interviews with experts and literature reviews revealed common challenges associated with 2D data visualization and storytelling, such as visual clutter—defined as 'elements that take up space but don’t increase understanding' (Storytelling with Data)—and information overload. We observed students struggling to convey the appropriate amount of context and information within the limited dimensions of 2D flat screens.
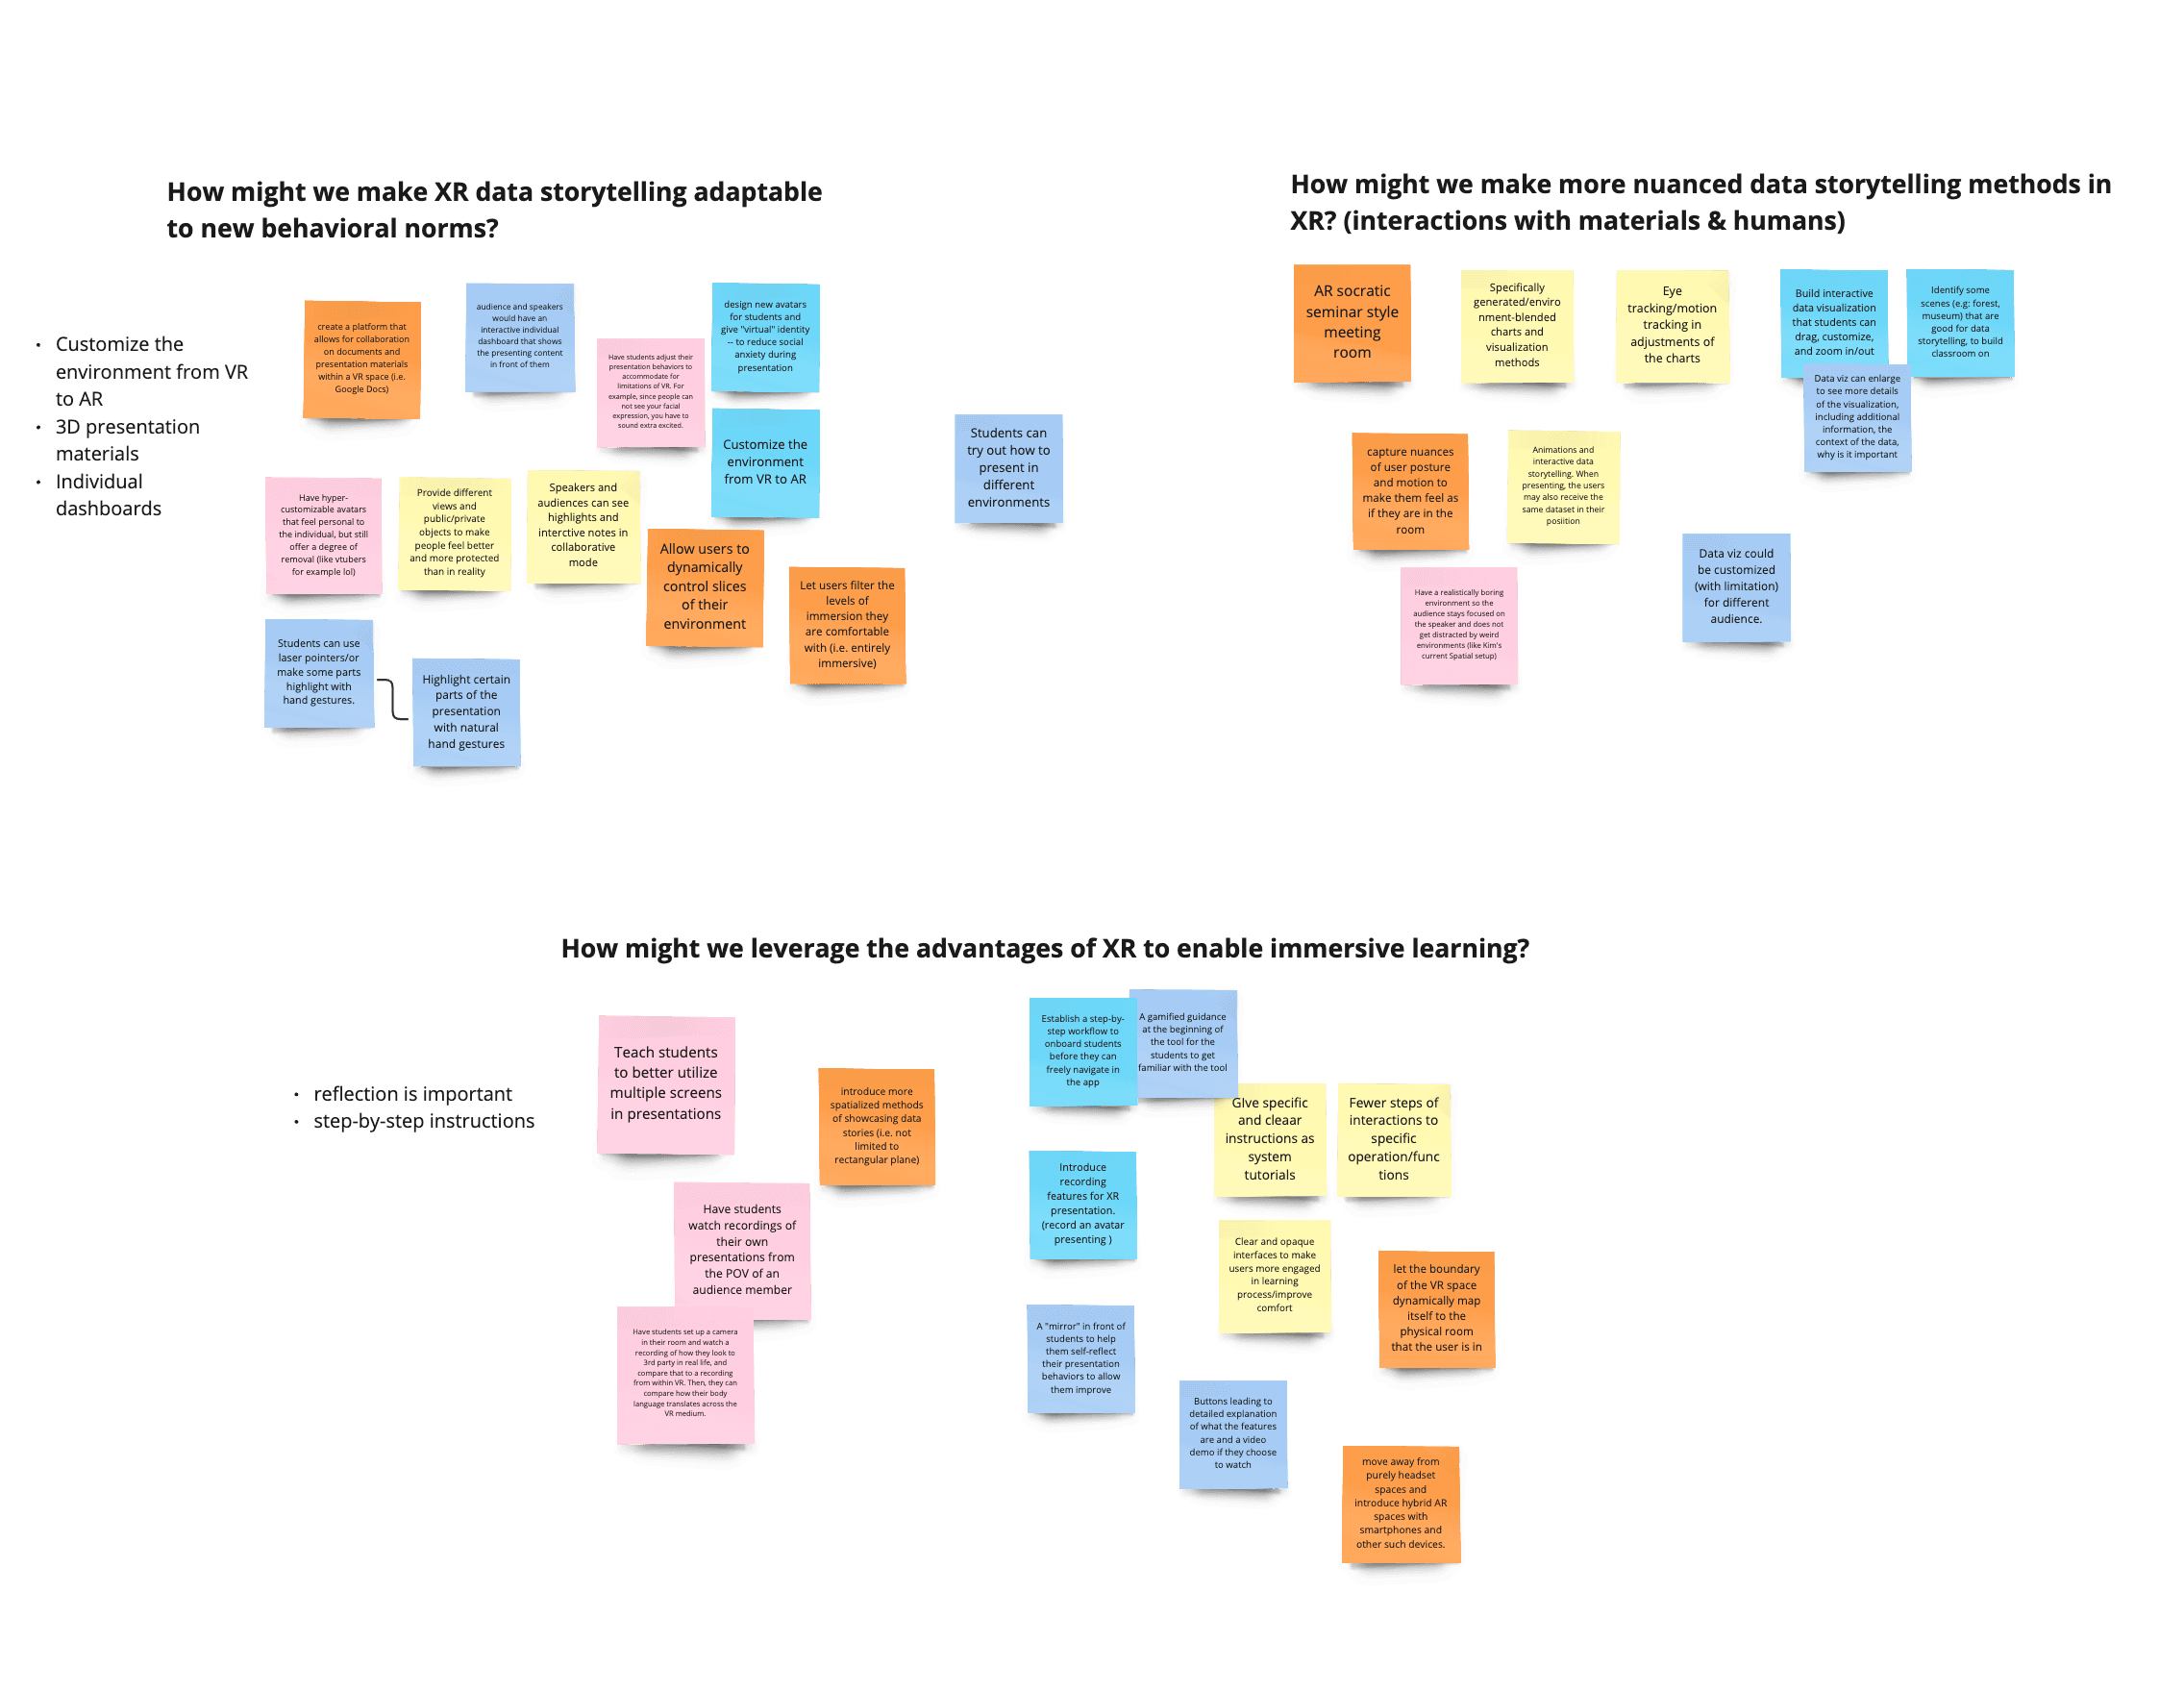
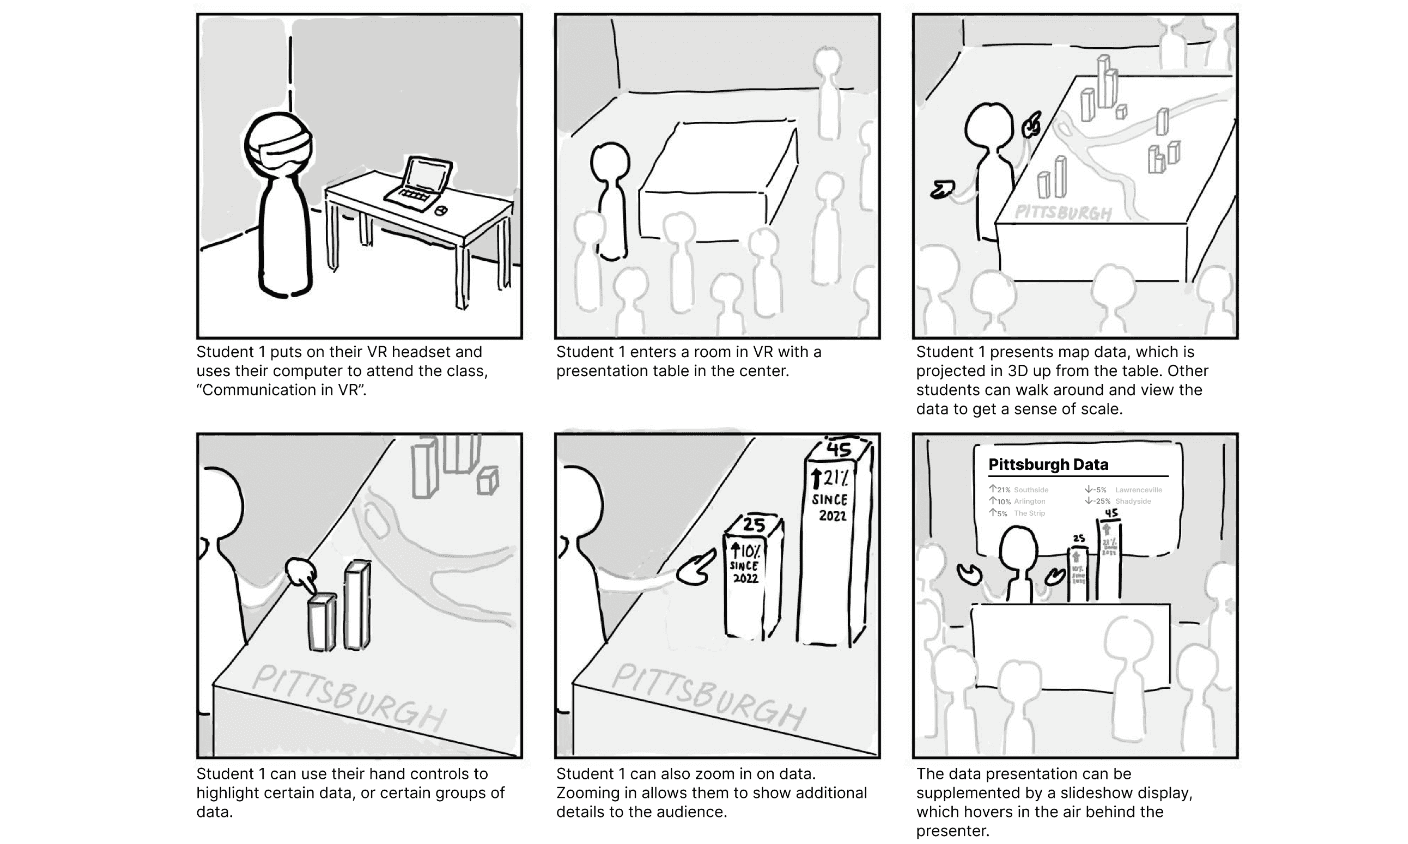
How might we make XR data storytelling and presentation adaptable to new behavioral norms?
How might we use the advantages of XR to give students a more hands-on, nuanced data storytelling experience?
How might we use the advantage of XR to give students a fully immersive learning experience?
1
2
3
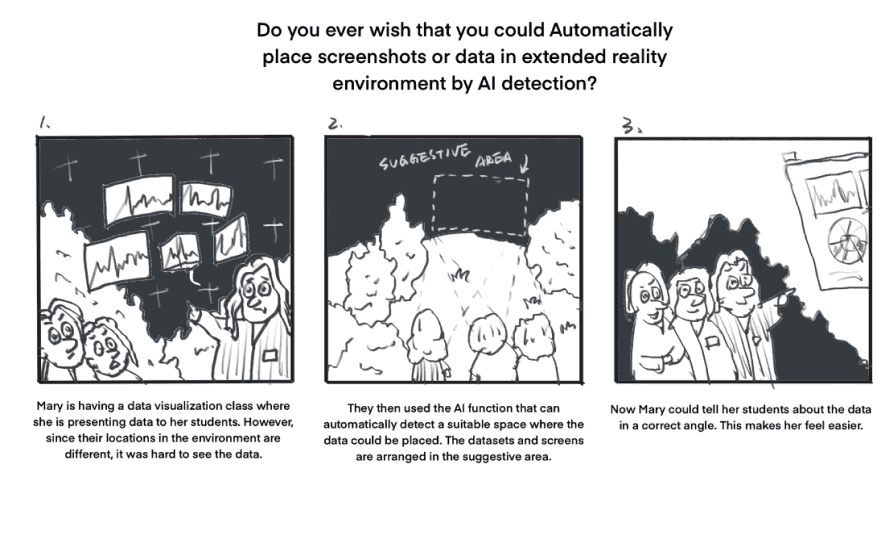
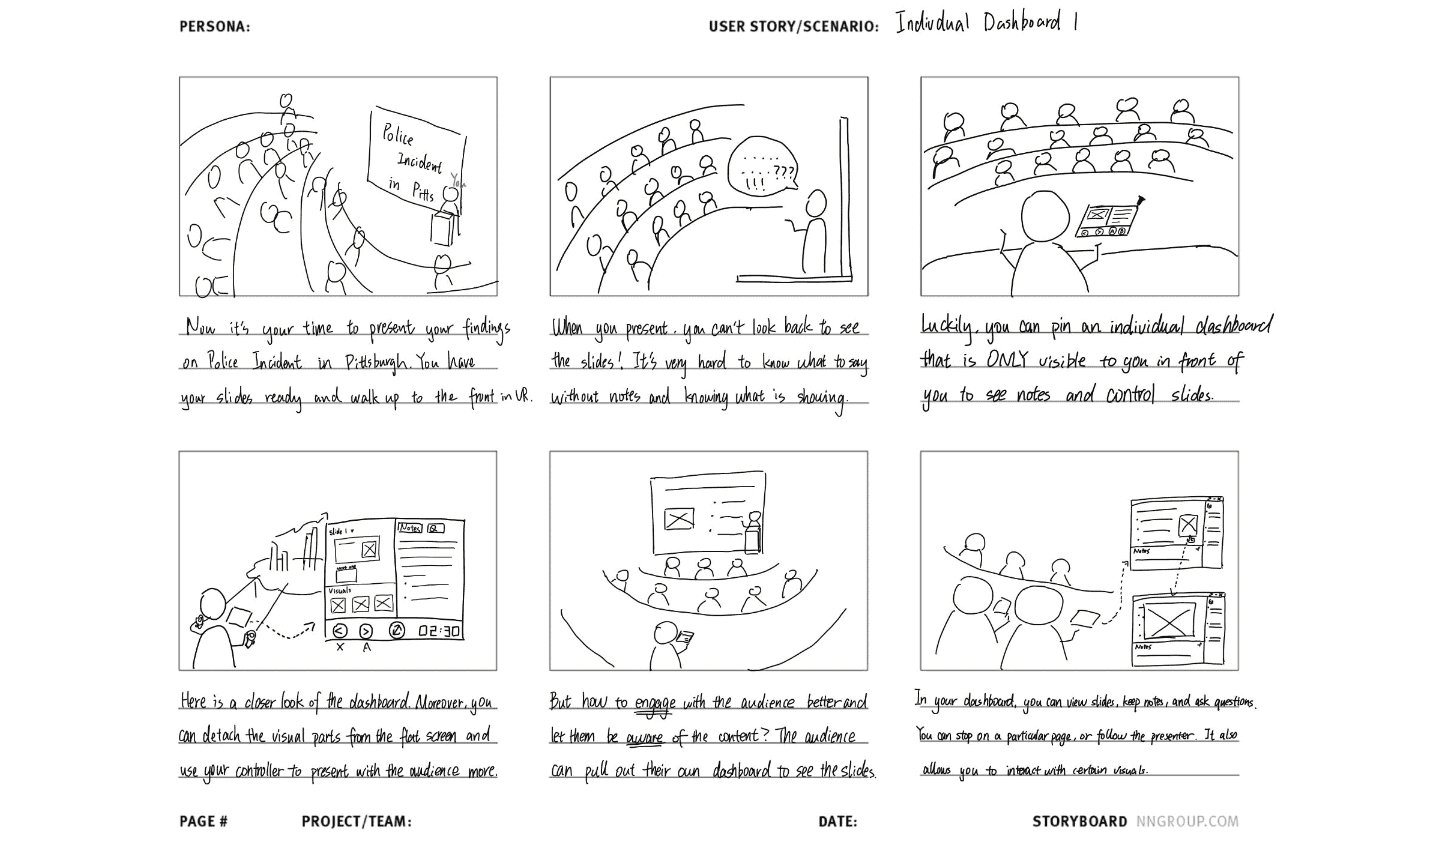
How can we transfer ideas
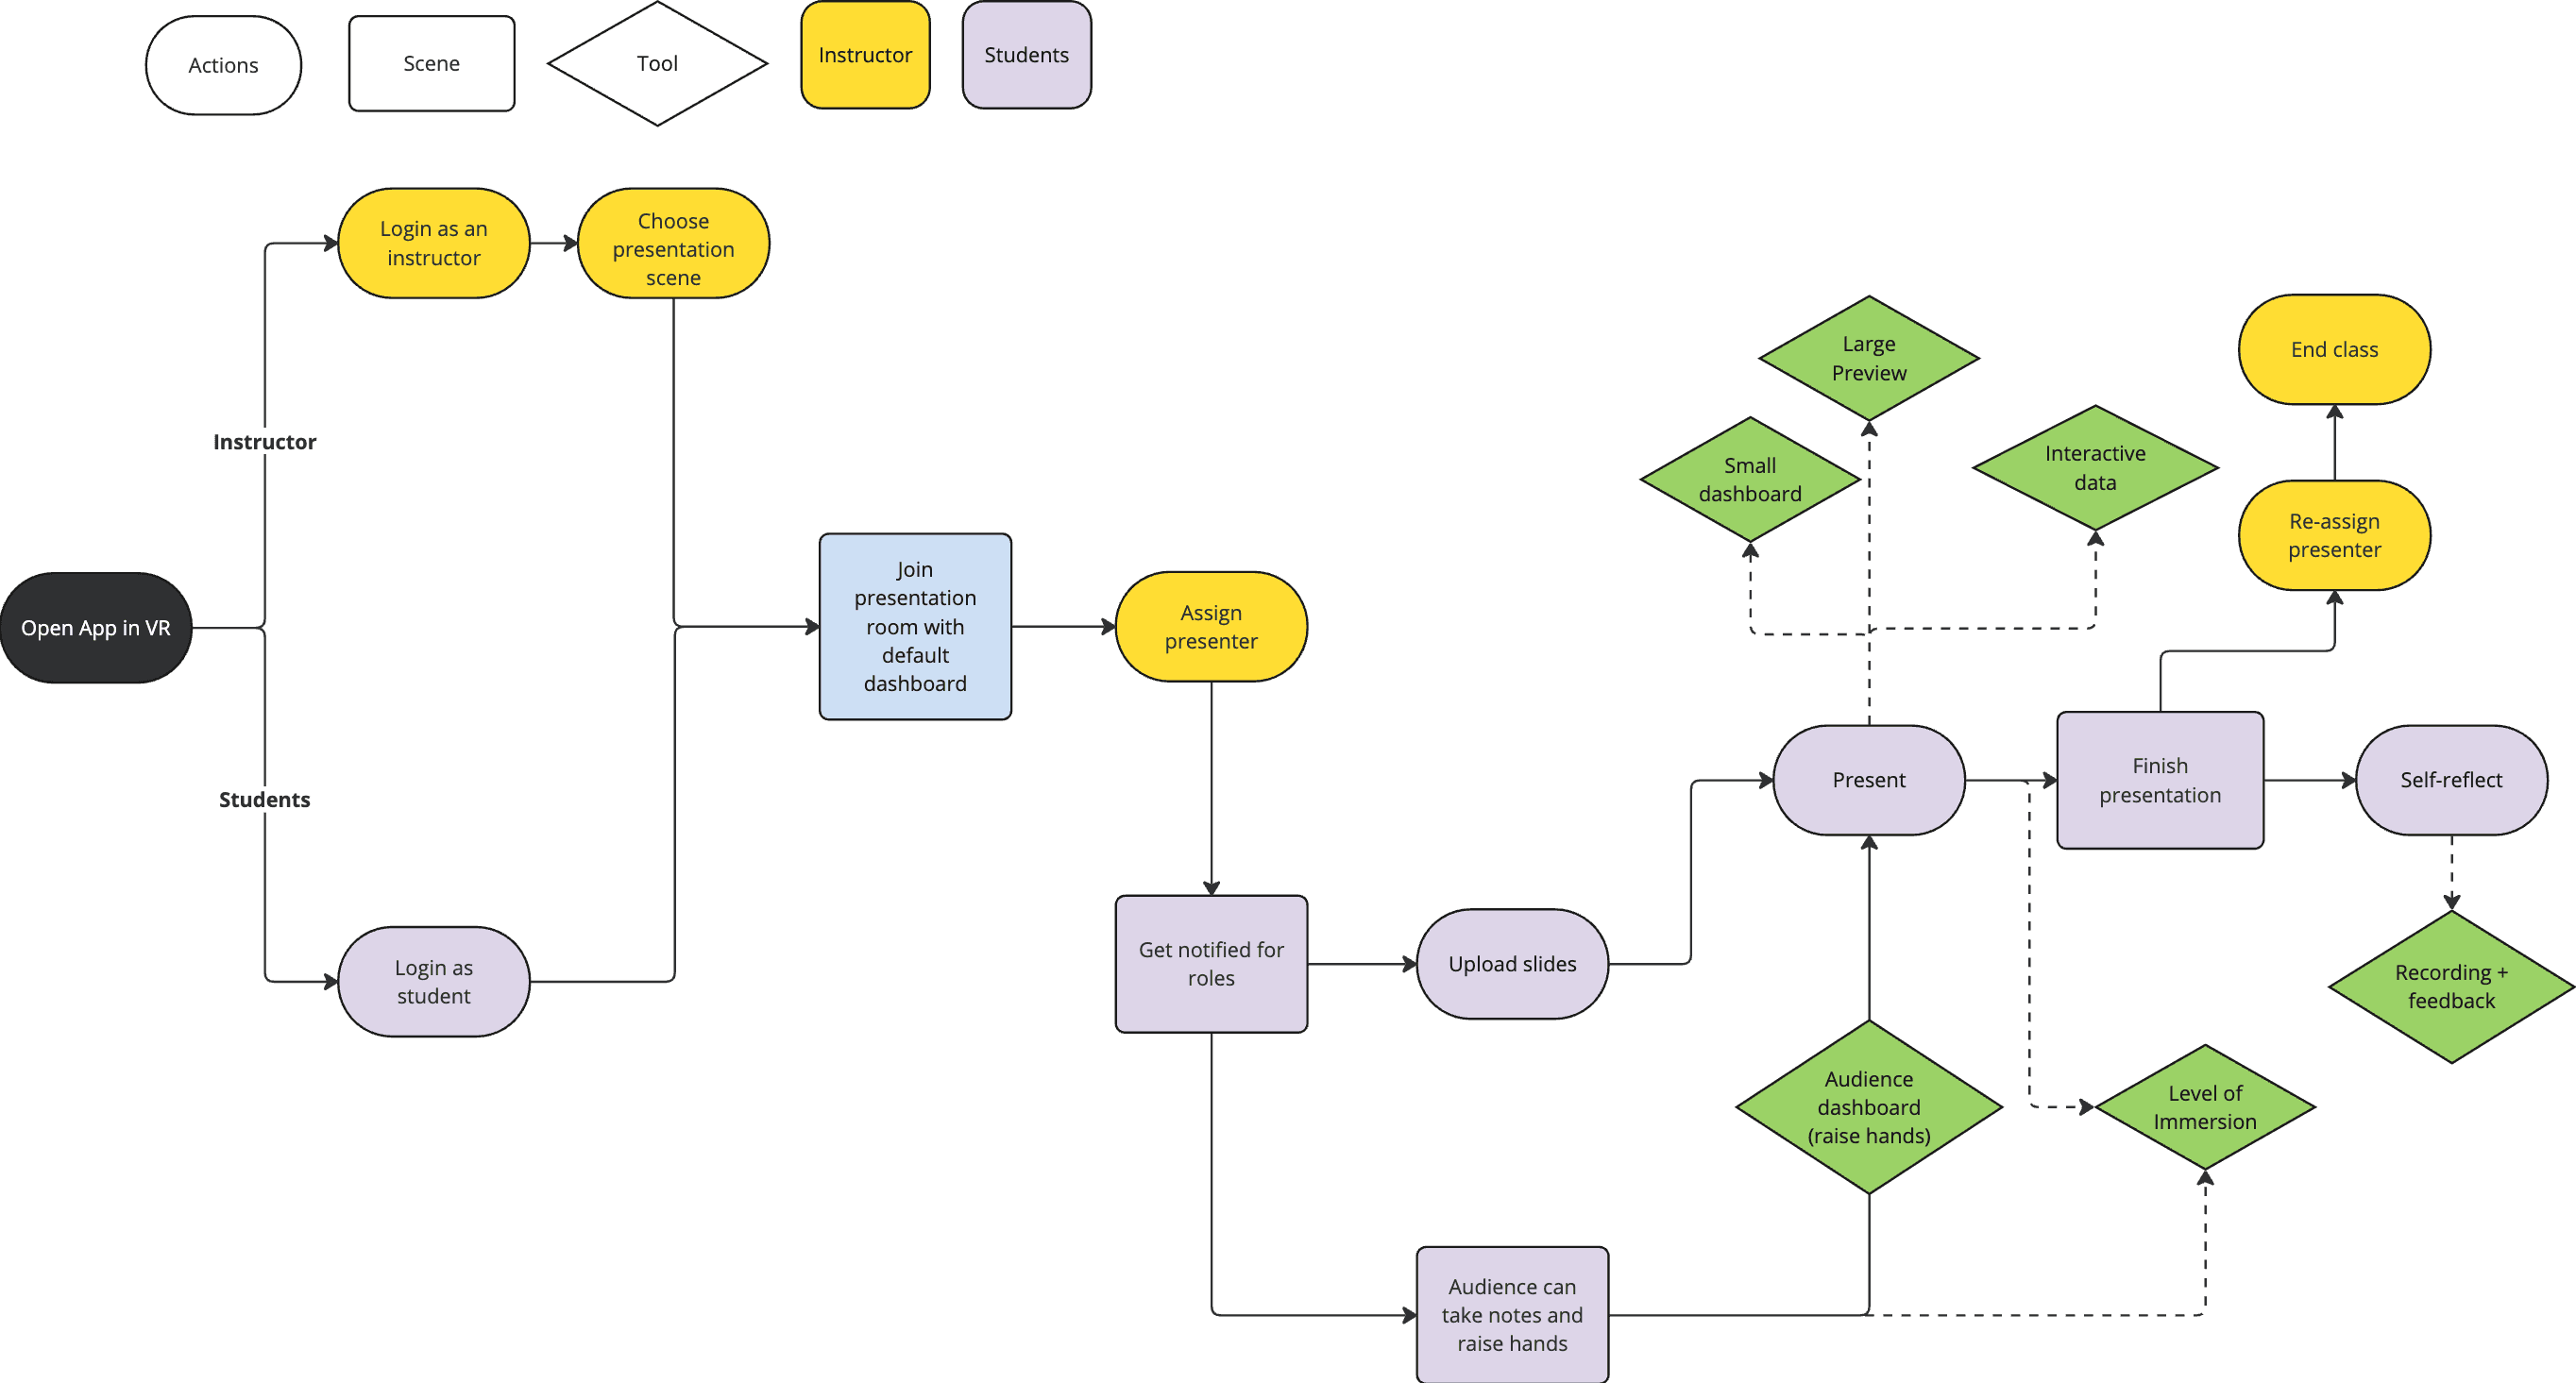
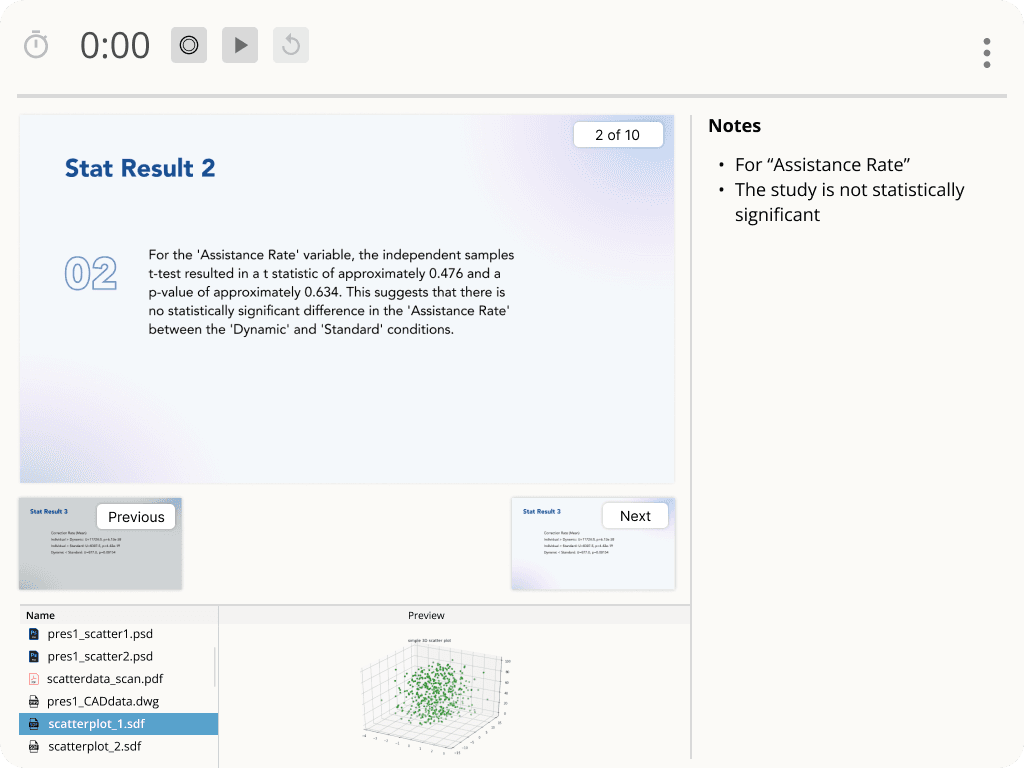
A presenting dashboard allow presenter to preview the slide contents and drag in the 3D data files.
Mid-Fi
Design Solution.
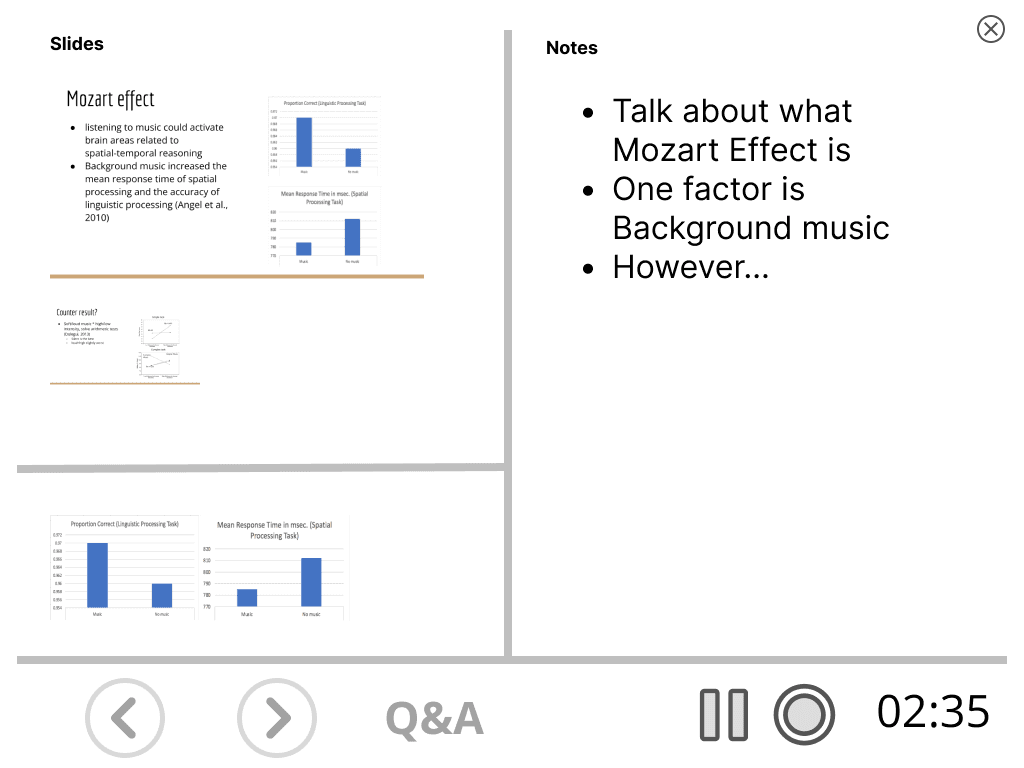
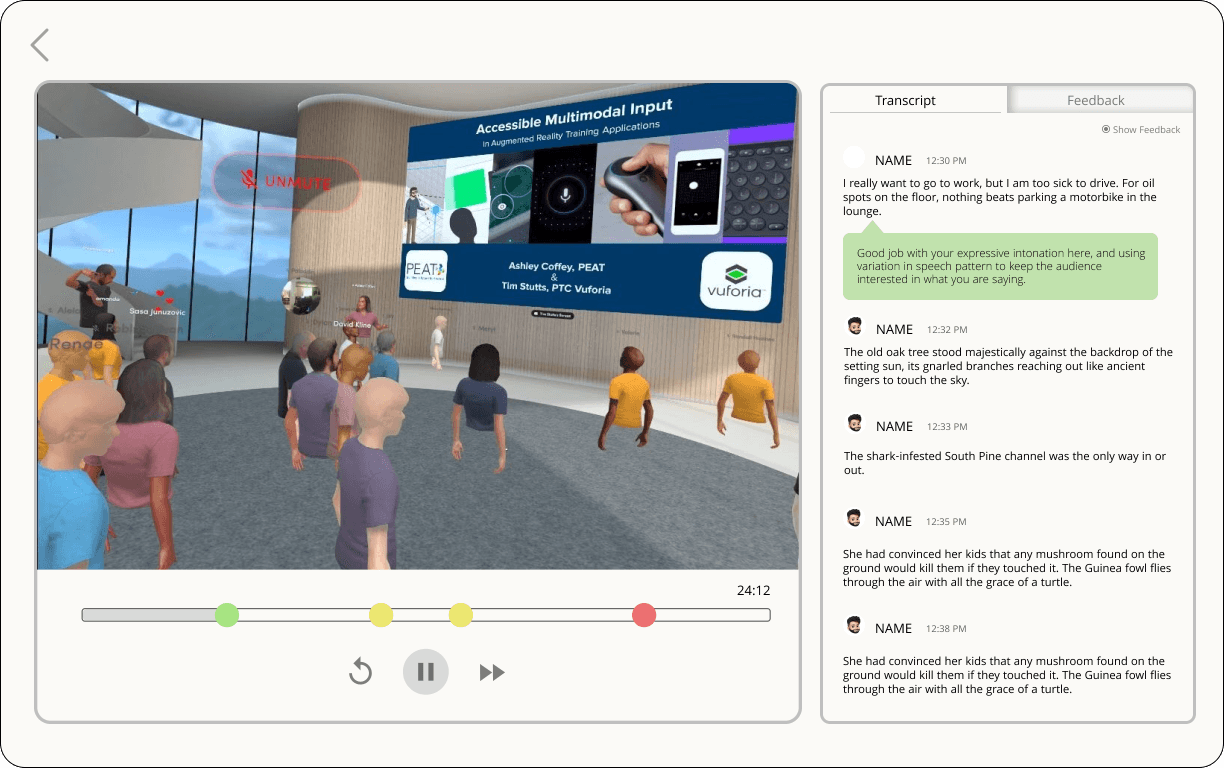
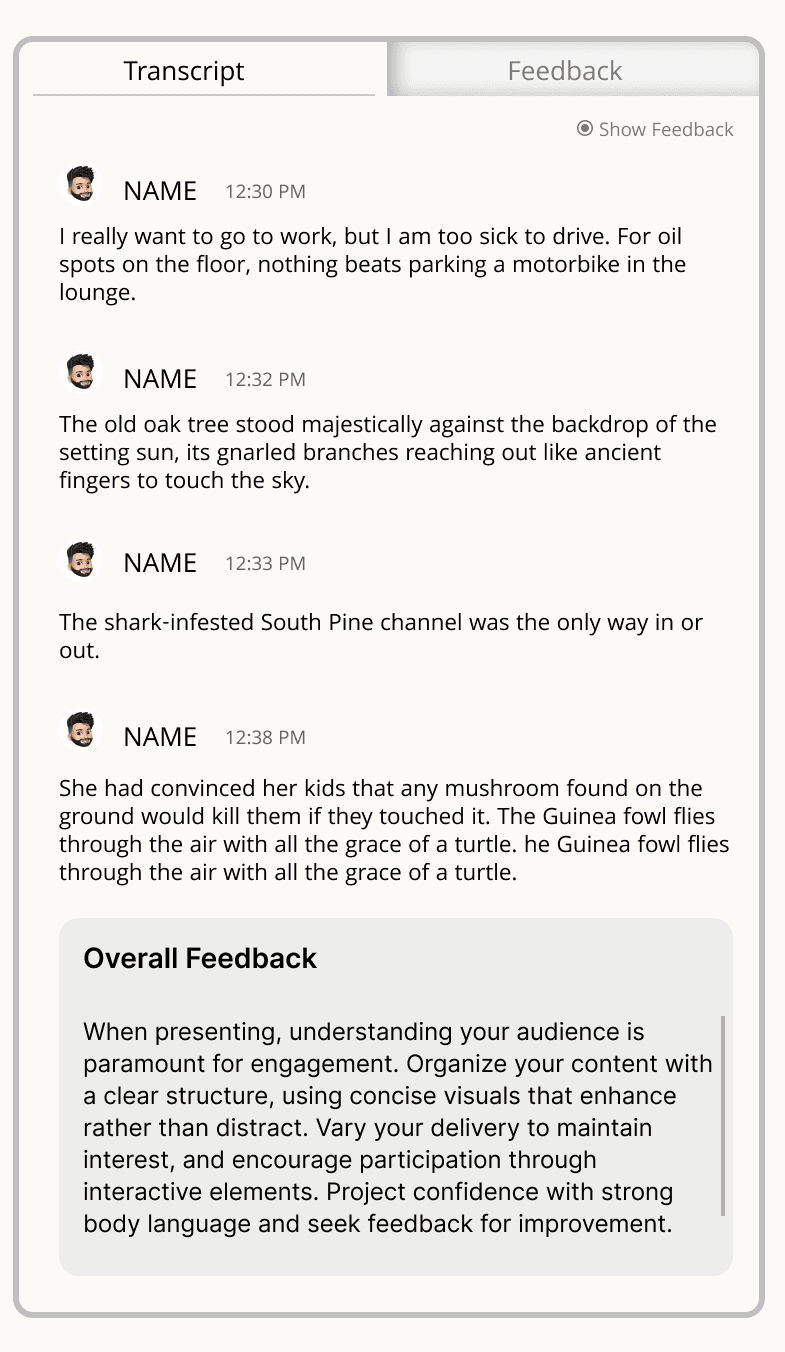
A recording/reflection dashboard captures the presentation content and provides feedback per paragraph, generated by AI.
Prototype!
After setting up the environment in Unity, we focused on implementing key features to enhance the presentation experience. We began with adjustable immersion levels, allowing users to control the opacity of non-essential VR elements. By importing an auditorium preset into Unity and creating a virtual slider with MRTK (Microsoft Reality Tookit), we enabled users to adjust the opacity of the auditorium’s walls and ceilings. This feature allows for a hybrid AR experience by revealing the real-world environment around the user. Next, we added slide preview features, including a presenter’s dashboard and a large preview screen at the back of the virtual classroom. These two features were prioritized because they were essential for creating an authentic presentation experience and were feasible to implement within our time constraints. As a result, we developed a robust mid-fidelity presentation experience that combines both practical and immersive elements.
User Validation & Technical Challenge
In response to our mid-fi prototype, our client expressed a desire for more development in the “data visualization” portion of the experience rather than the “presentation” (slideshow-related) part. Our client’s comments encouraged us to reconsider the overarching purpose of the project, and better prioritize presentation and interaction with 3D data.
We decided to substantially flesh out our scalable interactive data feature, as this would be the main way through which 3D data can be displayed and manipulated.
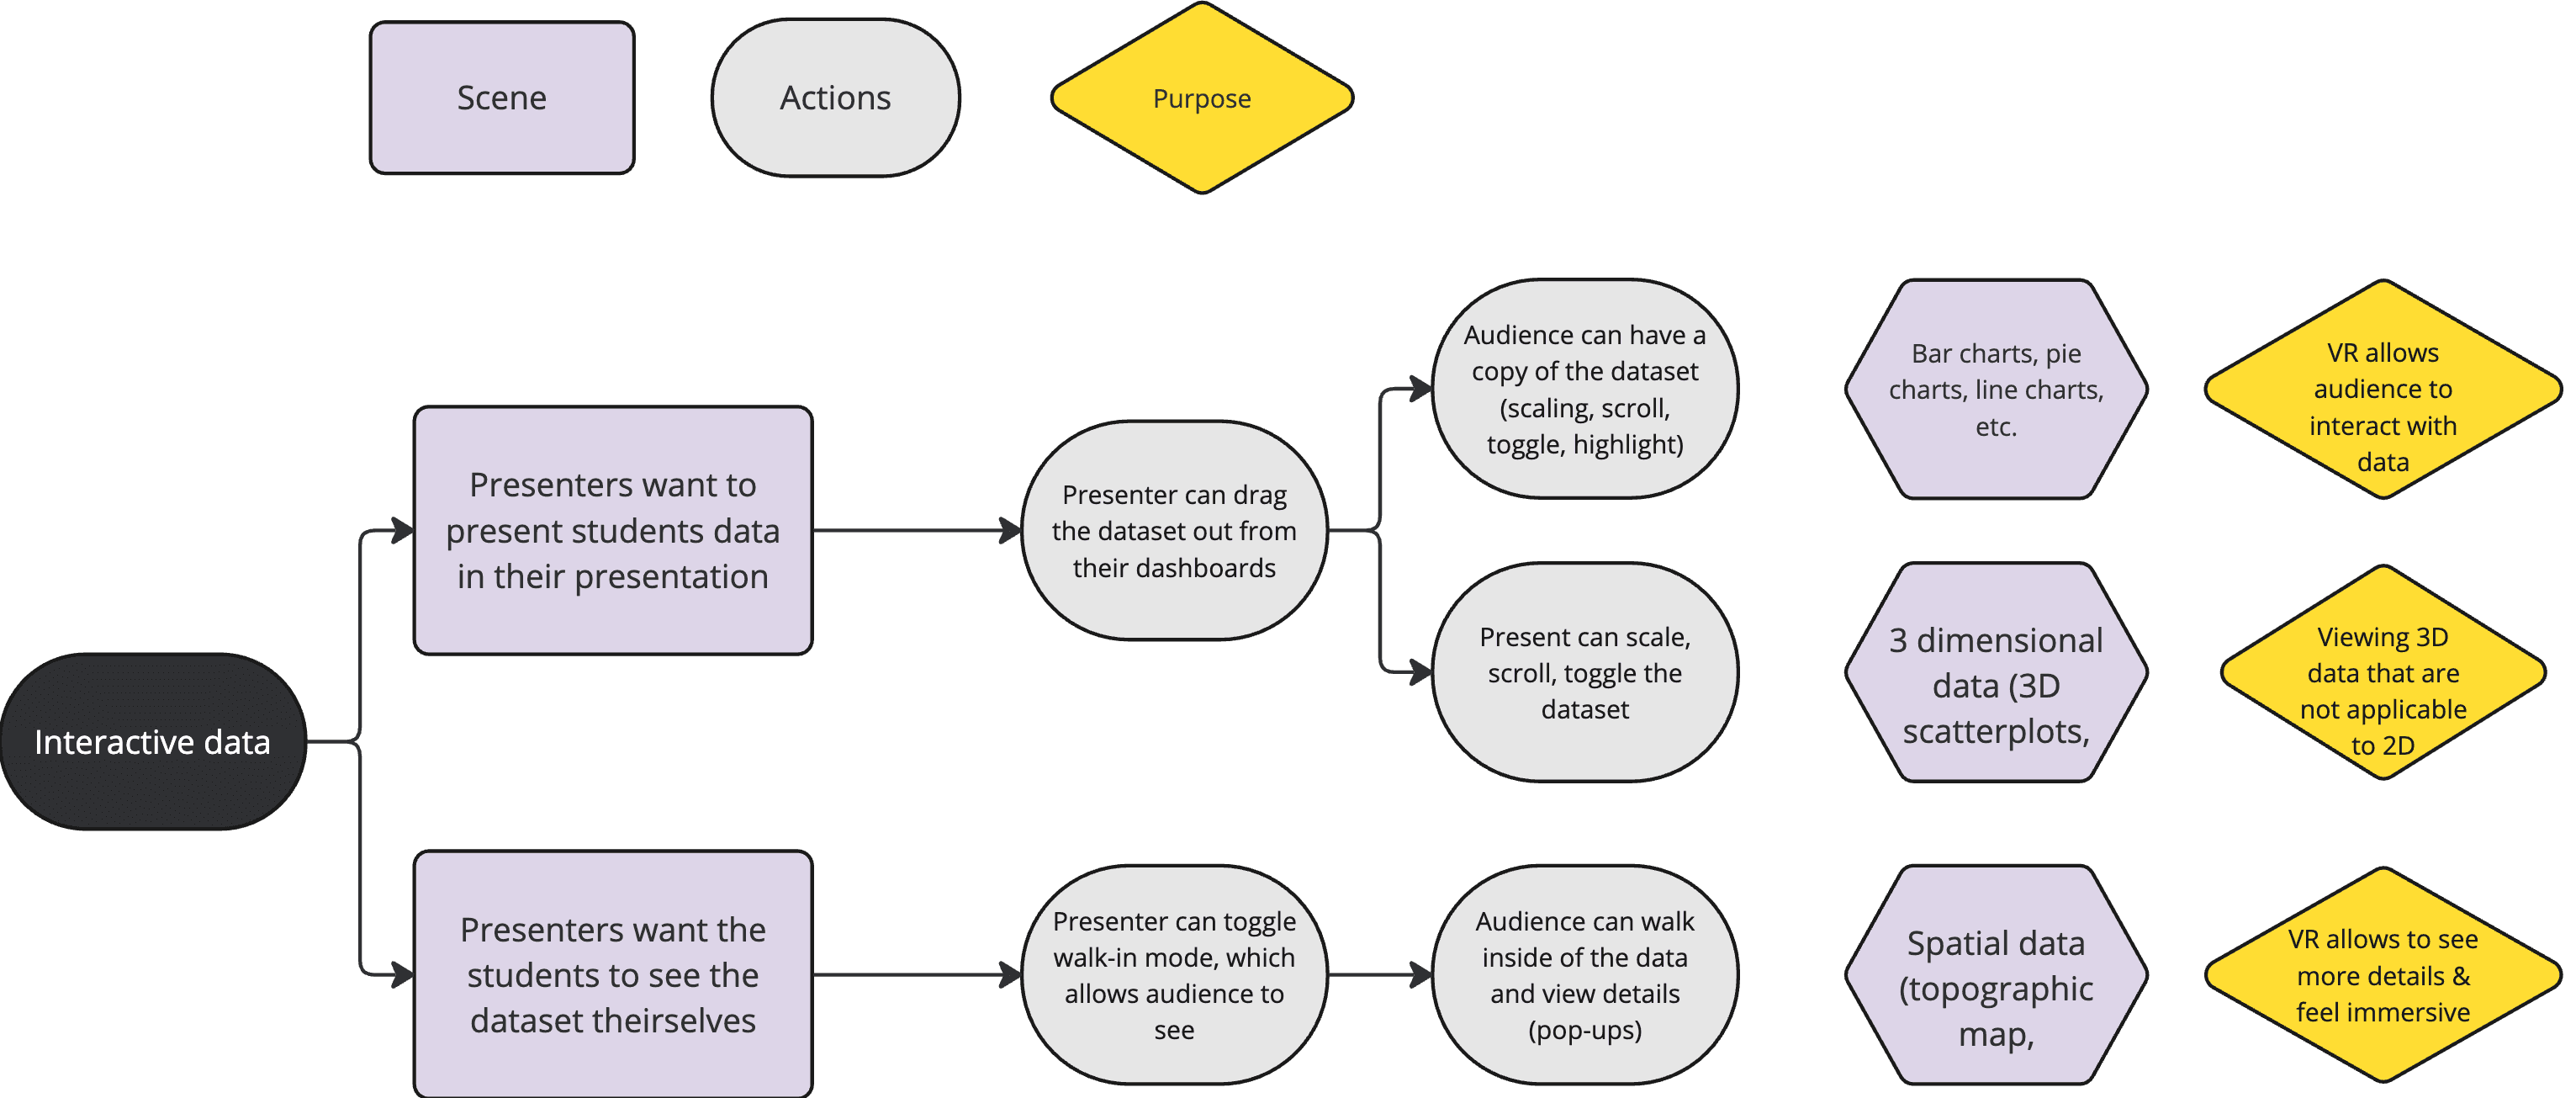

A Deeper Understanding of Data: What do they need?
We explored various use cases where adjusting immersion levels in VR would benefit users, including in-person and fully virtual meetings. For in-person meetings, students can use VR headsets to interact with 3D datasets in a shared physical space. In fully virtual settings, presenters can adjust immersion based on comfort or environmental distractions. Although this feature could be used in hybrid meetings, where some users are remote and others are together, it is less ideal due to potential overlap between virtual and physical objects, reducing XR effectiveness. Our prototype focused on in-person and virtual meeting use cases. Additionally, we researched data visualization to understand the best ways to represent different data types in VR. We identified three types of 3D models—3D scatterplots, GIS diagrams, and city models—as effective for demonstration in VR. These models are ideal for VR based on our research findings and enable better interaction between presenters and their data.
At the same time, the technical challenge of applying 3D datasets in Unity became unavoidable. How can we effectively express 3D datasets while maintaining its balance with basic presentation? How can we make this in Unity?
What types of data?
How we interact with data?
Final Solution.
Dashboards.
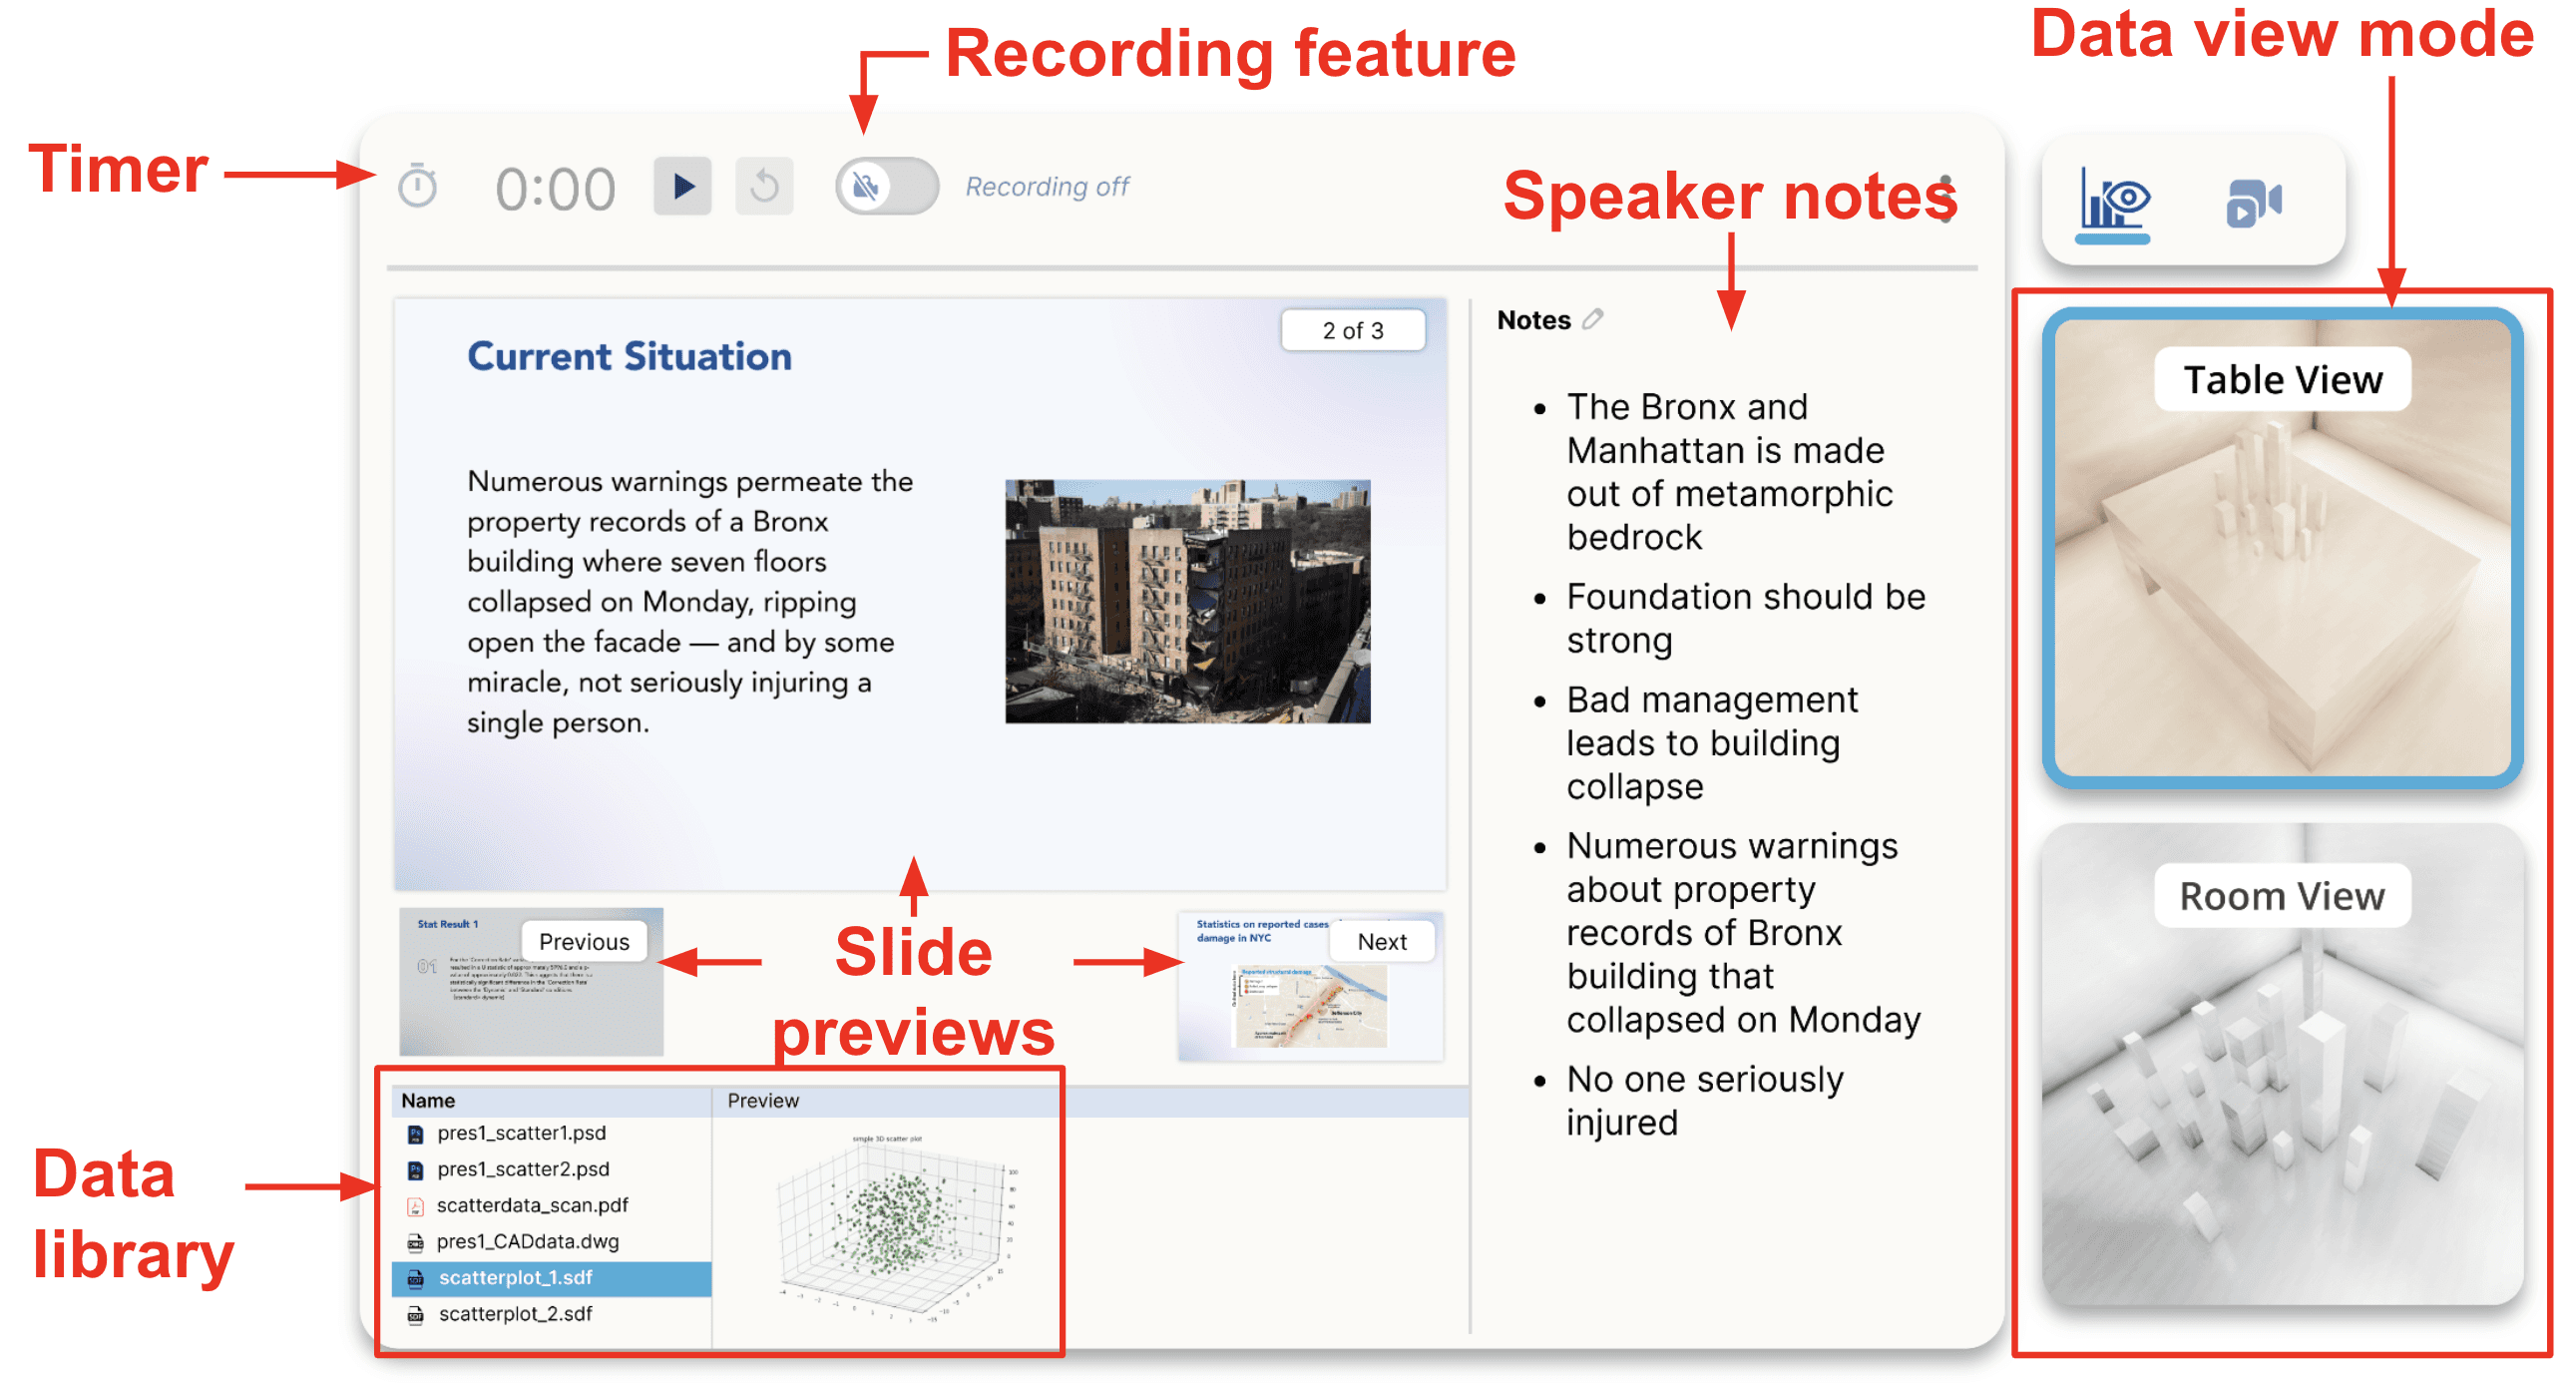
Updated Presenter Dashboard
Besides the previous functions, to show 3D data visualizations, students can drag the pre-loaded file out from the dashboard and place it in the environment. Students can also change the view mode of their 3D data visualizations.
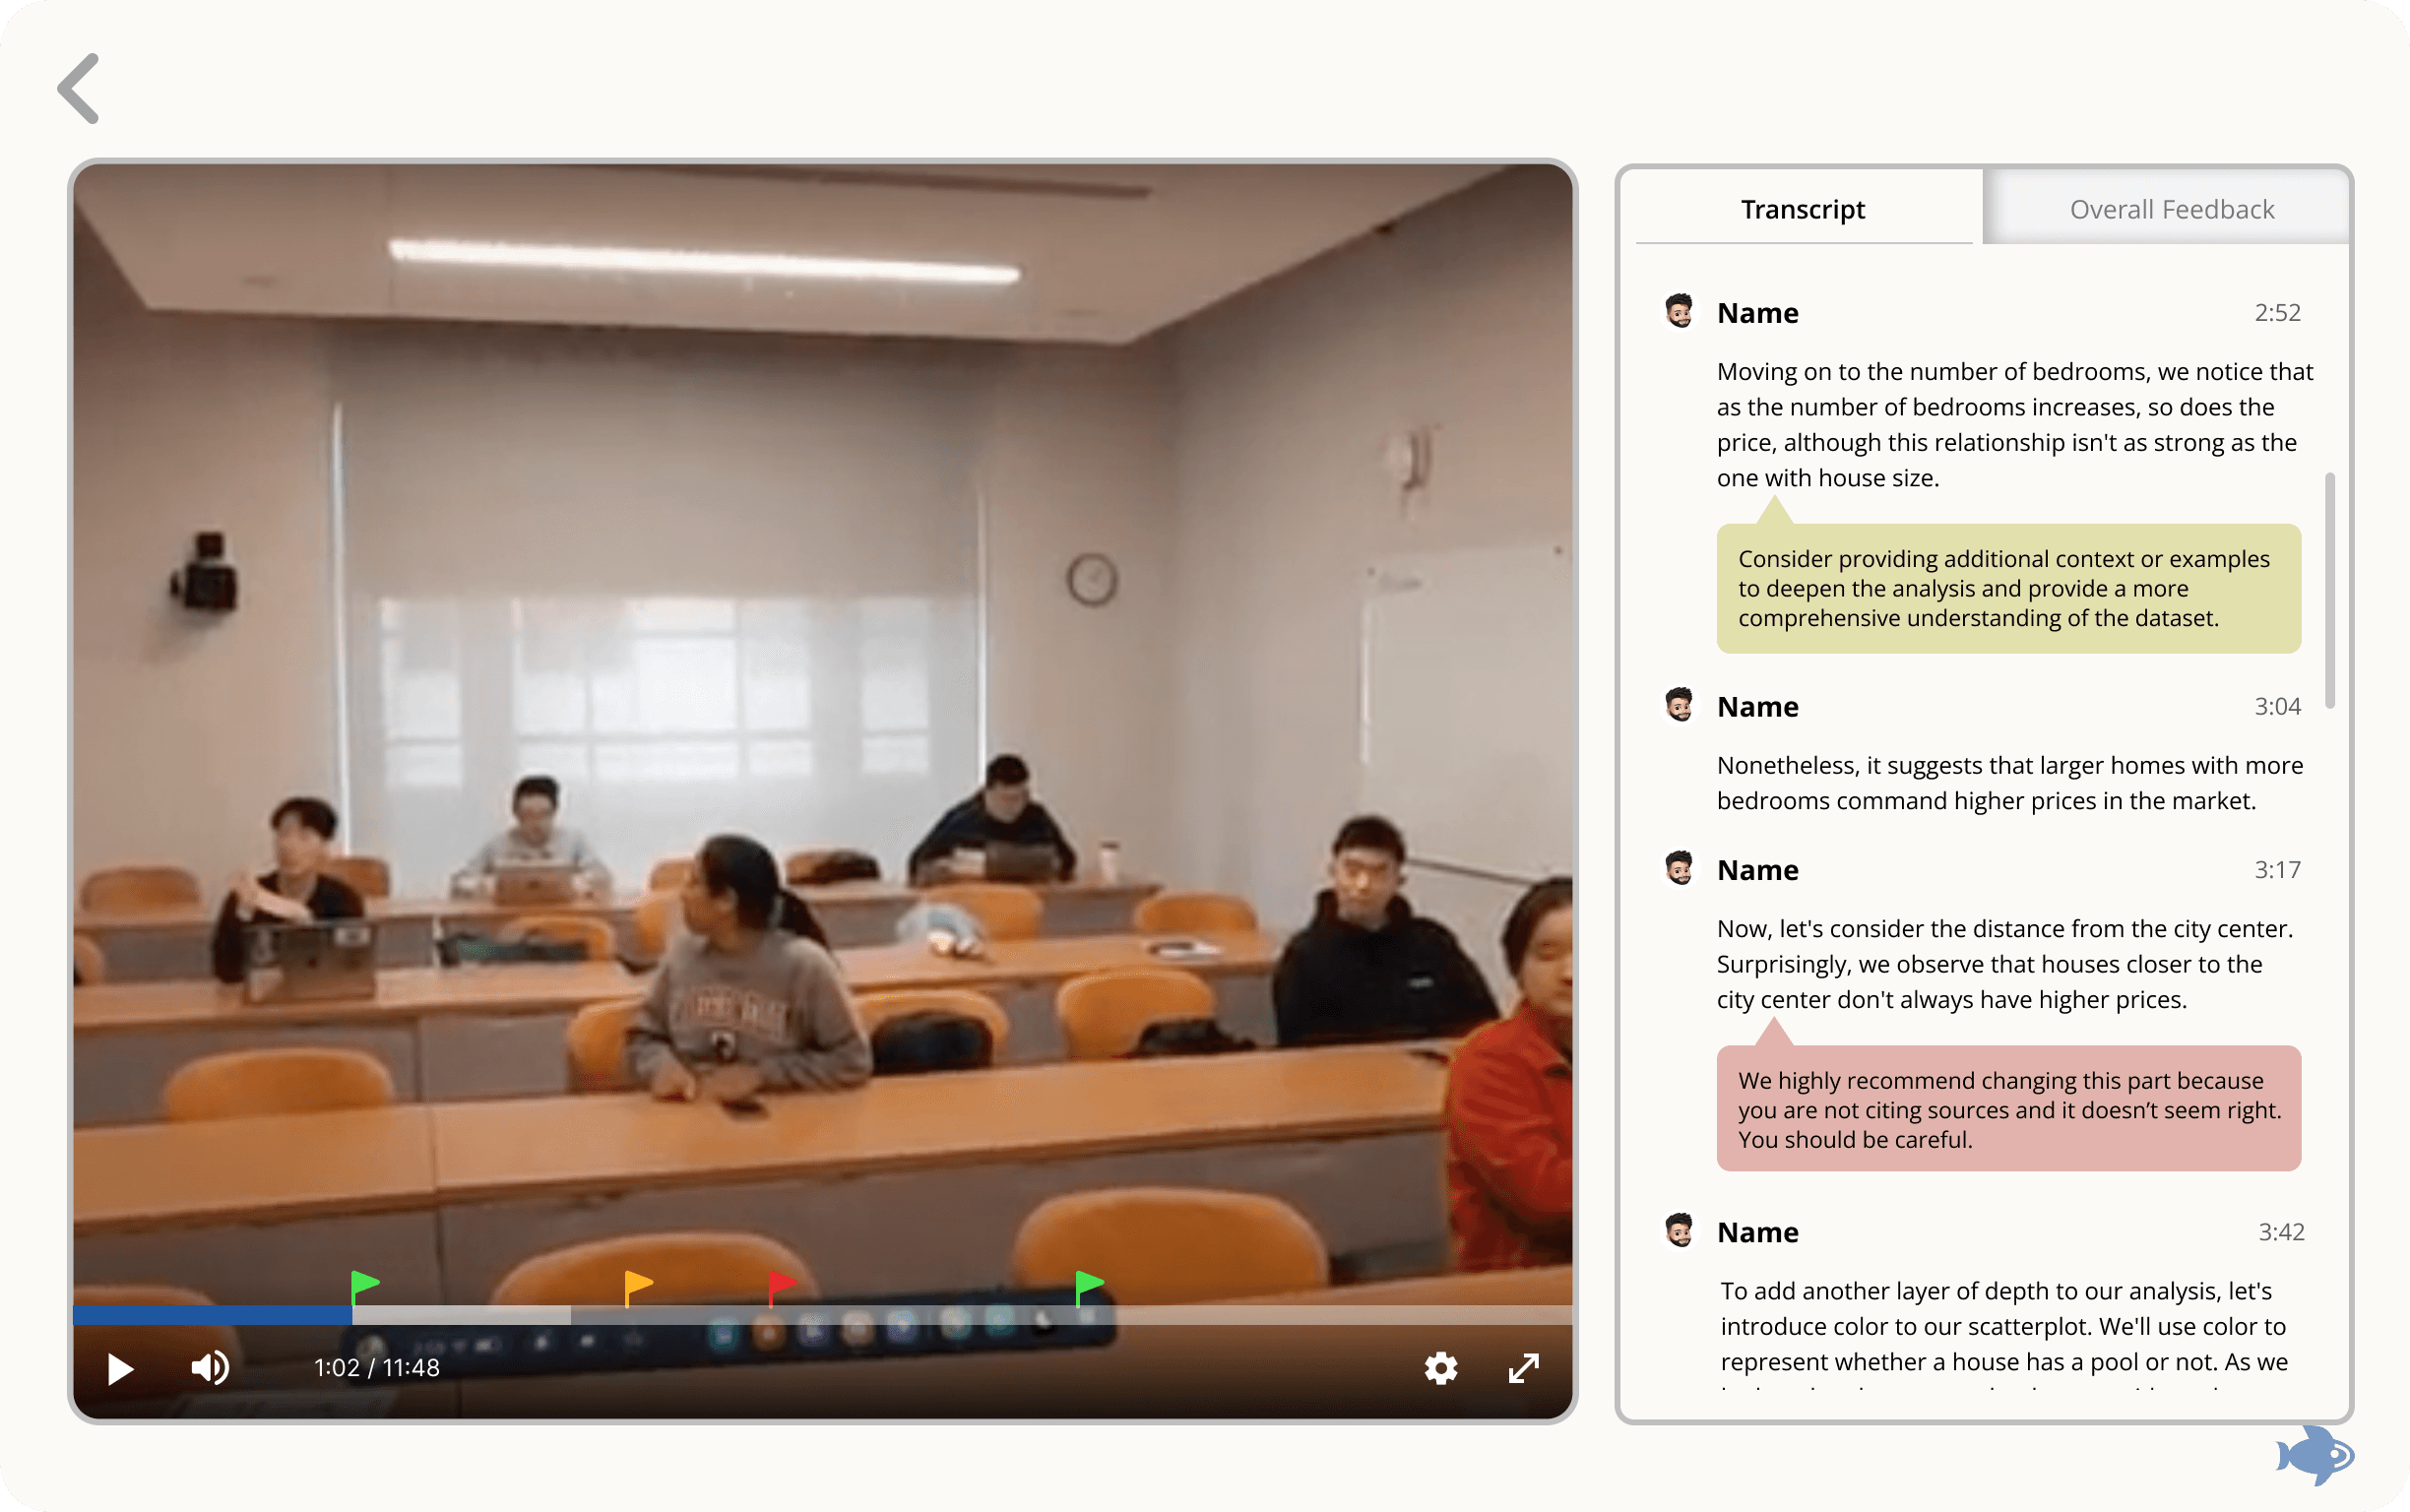
Updated Review Dashboard
After the presentation is done, students can use the dashboard to access their presentations recording, where they will also have AI-generated feedback for them to self-reflect. There are two types of feedback: time-coded (coded in green, yellow, and red) and overall feedback.
Audience Dashboard
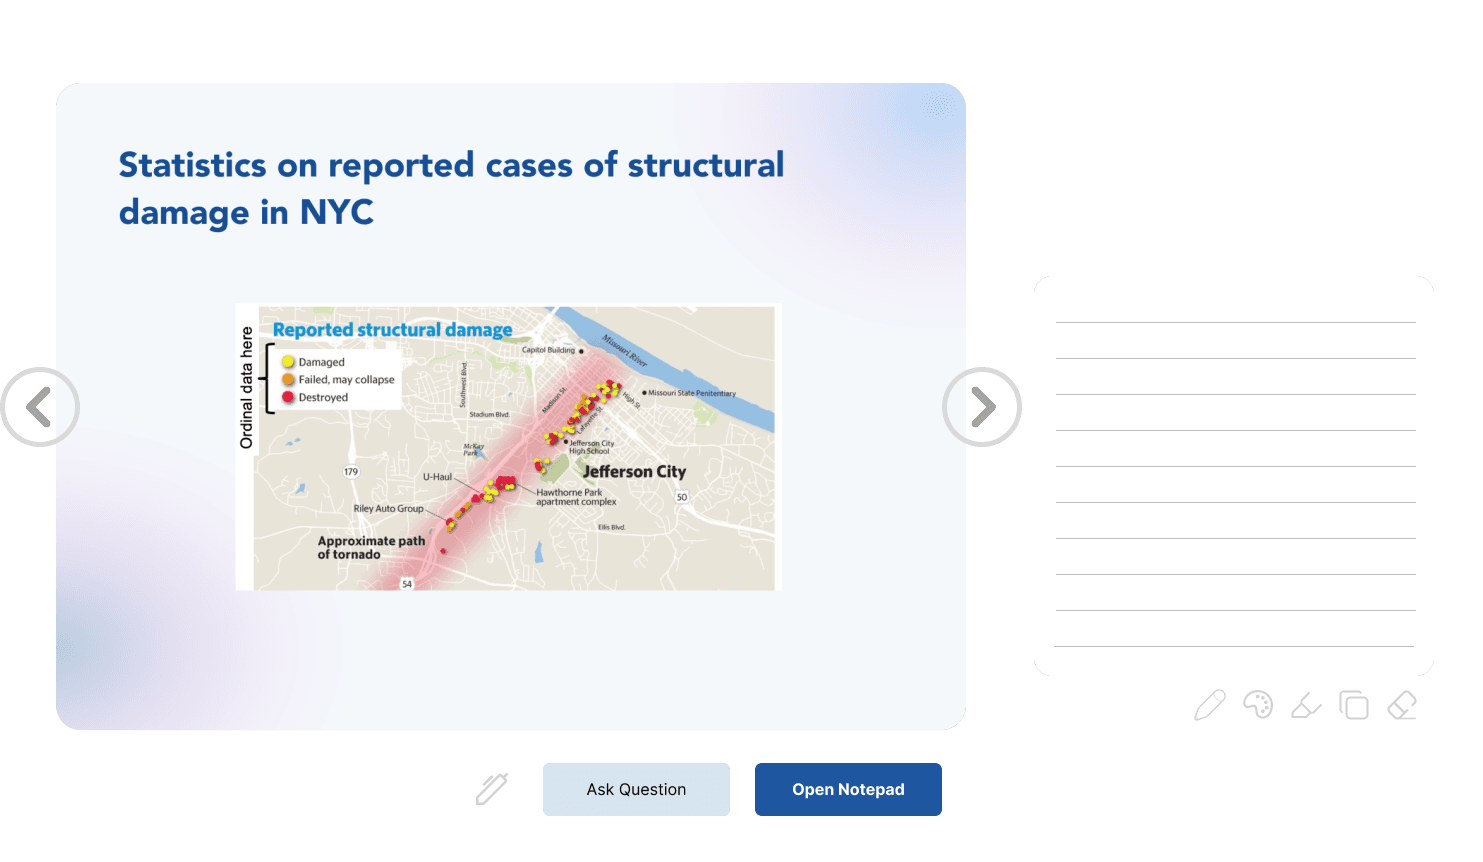
The audience will also have their individual dashboard to follow along or read through the slides at their own pace. The “ask a question” and “notepad” feature were developed to promote audience interaction with the presentation. This can be helpful for students sitting in the back or at odd angles that prevent them from having a clear view of the presentation.
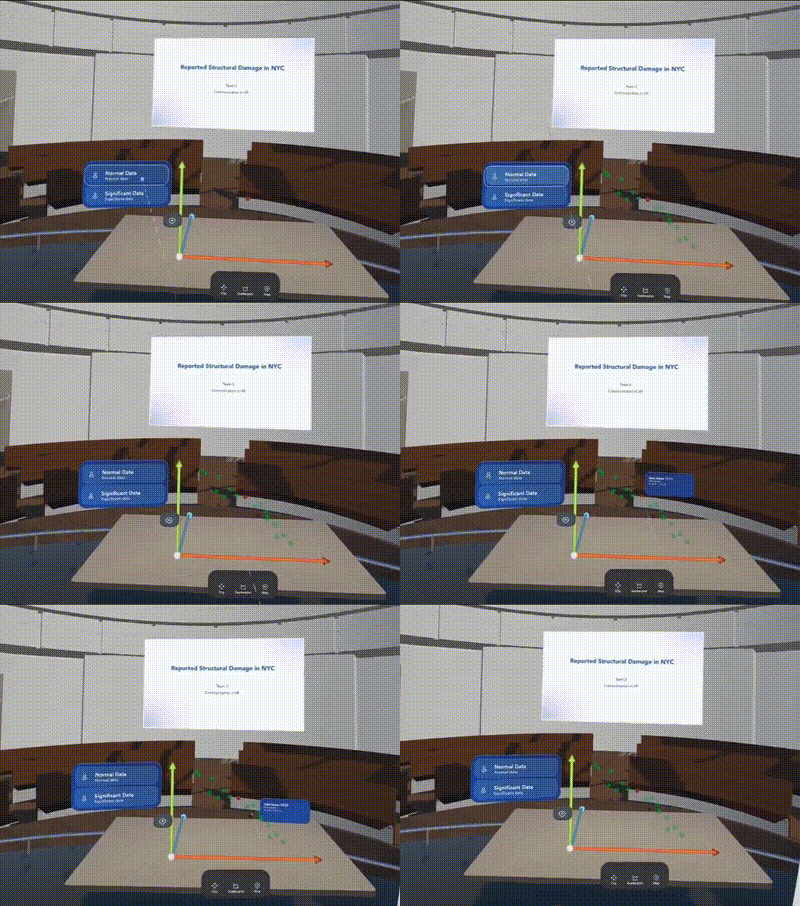
Scatterplots
Users are allowed to import and transform datasets from xlsx. file to a 3-Dimensional data model on the virtual desk. They can classify data points (recorded as a x,y,z value) and hide/show the data groups.
Final Solution.
Scalable Interactive Data.
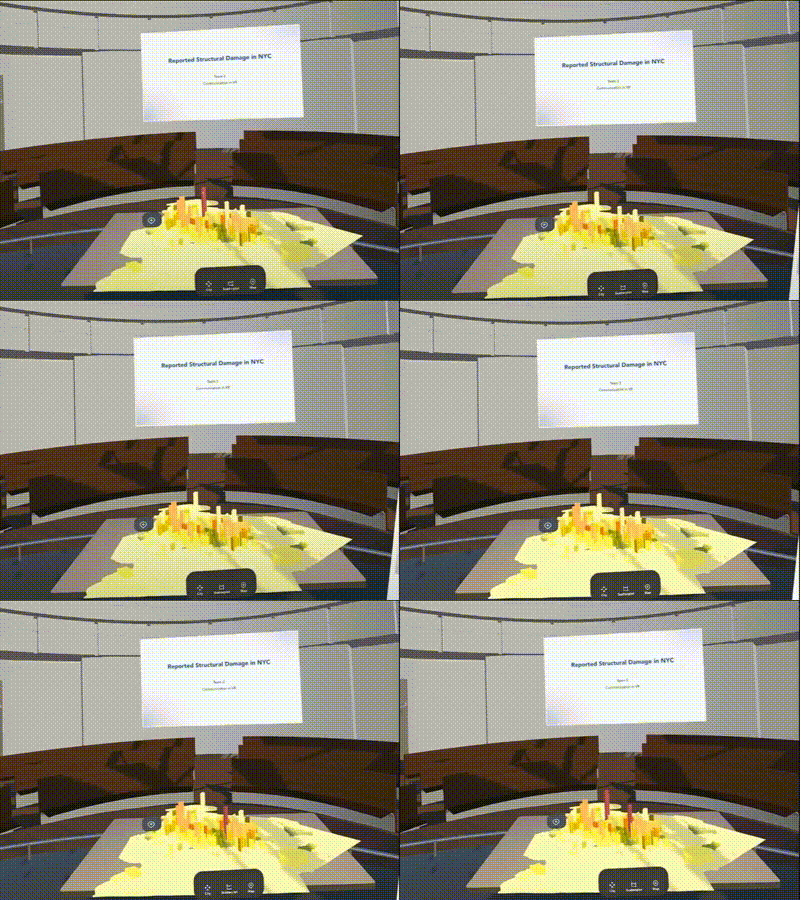
ArchGIS Data
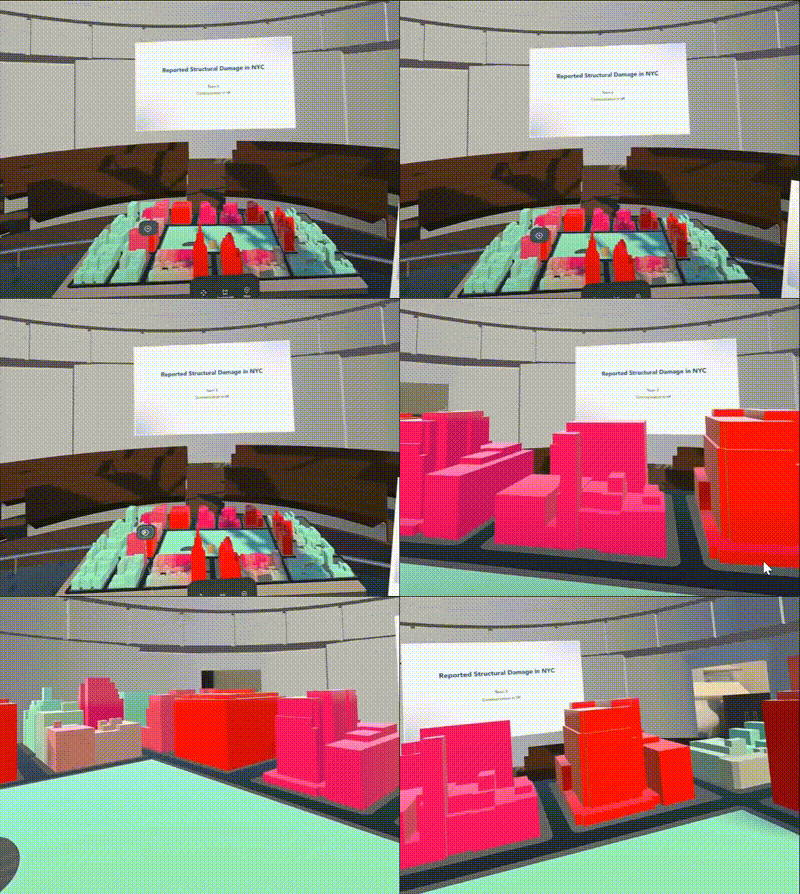
Geographic related models (GIS, Geographical Information System) could be installed from the ArchGIS plug-in of unity. Users can click and highlight specific data columns and get its value.
Walkthrough mode
A first-perspective view mode for architectural models may be useful when presenting smaller scale city-related contents. Users can click the transform button and enjoy a great viewpoint just like in the real city.
Easy adjust your immersion level.
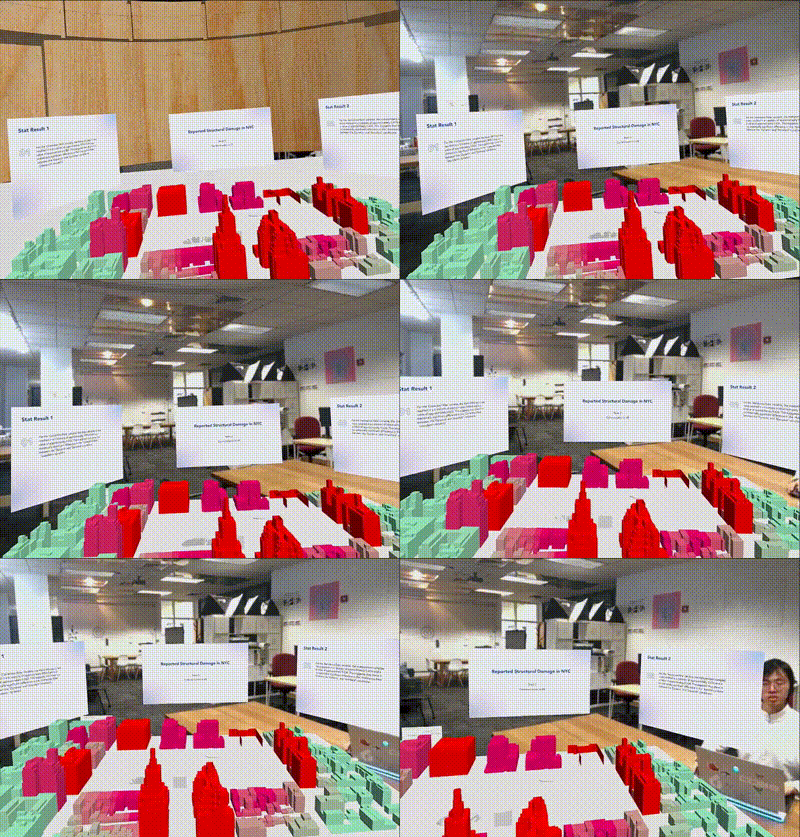
An ultimate solution for the dizziness and discomfort — the fully functional immersion adjust has been worked out. Using a slider, users can stick on any immersion value that seems comfortable. This function is specially made for Quest 3 and Pro.
Final Solution.
Immersion Slider.
Client is a great factor through design changes.
Not all of clients know what we are doing — even what they actually want. Convincing our client became one of the trickiest parts through the design process. During our mid-fi prototyping phase, our client switched her demand from "learning in VR" to "storytelling" when she found we have not applied everything about the data models. However, she didn't know — the data model import is easier than anything that we have done. Hence, while doing design decisions and changes, we should make sure we clearly balance the technical progress with the user's temporary expectations.
Takeaways.
Plan everything first and then collaborate.
An unprofessional mistake in work distribution happened during our prototyping process: since the device limitations, only 1 of 2 programmers and 1 of 2 UX designers (Me) had access to the Unity prototype. Also, we are using my private headset for user tests. This substantially increased my workload (though it made me a Unity expert after that). If we had the chance to plan the works beforehand, such as shifting the focus to interface/model design or using another software for prototyping, we may end up having a more successful design outcome.
Everyone should possess a technical insight.
We encountered a lot of pivots in the design process since we completely broke the part in dashboard interface designing, UX researching, and prototyping. This is definitely not a good practice especially when half of the process is "realizing the functions". Since designers do not understand how programming/Unity works, many of the insightful ideas and functions were produced "in the wrong time". These ideas haven't had a chance to be released.

